


Faculty Research Rankings TEST PAGE
This webpage provides statistics for per-capita productivity of business schools in 24 leading journals covered by the University of Texas at Dallas Top 100 Business School Research Rankings in 2015–2018. (Please see list below).
The UTD rankings measure total output not correcting for tenure-track faculty size. In order to understand differences among schools in average productivity of the faculty, we produced a set of “per-capita” publication statistics for the top 100 schools in the UTD rankings. First, we used a method emulating UTD to obtain a total score for school X. We then divided that score by the number of tenure-track faculty listed on the school’s website in spring of 2018.
We provide per-capita rankings using two different methods to count the number of tenure-track faculty in the denominator of the ratio score/number of tenure-track faculty.
#24
CU Boulder's Leeds School of Business
World per capita UTD ranking
2015-2018 World With Exclusions Rankings Report
DATA: Data was pulled from UT Dallas for including all 24 journals from 2015-2018 for the World rankings on January 21st, 2019 . The UTD ""Score"" in column E comes from the UTD Website. UTD counts number of papers those in top journals. For each paper UTD divides up credit among the authors. So if a paper has two authors, each school the author list as their affiliation will get .5 added to their UTD Score. In column H, Score / Number of faculty simply divides the UTD Score in column E by the number of faculty in column G. Please see the tab ""Faculty Count"" for the counts of faculty for each school. Faculty counts are from schools' websites and were pulled in Spring of 2018. If a school has fewer faculty now than reference period, it ""helps"" the school's per capita ranking because faculty who left contribute papers for numerator UTD Score but not denominator. If a school has more faculty now than reference period, it ""hurts"" the school's per capita ranking because new faculty's papers are not in the school's UTD score but are in the denominator.
Excluded Department include: Law, Economics, Statistics, Healthcare Management, International Business and others please see ""Faculty Count"" tab and the notes for each individual school.
| Per Capita UTD Rank | Rank | University | Articles | Score | Country | Number Faculty | Score / Number of Faculty |
|---|---|---|---|---|---|---|---|
| 1 | 31 | University of California at Berkeley (Walter A. Haas School of Business) | 97 | 49.26 | USA | 52 | 0.94730769 |
| 2 | 8 | Duke University (The Fuqua School of Business) | 156 | 73.42 | USA | 78 | 0.94128205 |
| 3 | 4 | Columbia University (Columbia Business School) | 170 | 80.7 | USA | 87 | 0.92758621 |
| 4 | 7 | Stanford University (Graduate School of Business) | 157 | 77.8 | USA | 86 | 0.90465116 |
| 5 | 1 | University of Pennsylvania (The Wharton School) | 254 | 139.18 | USA | 163 | 0.85386503 |
| 6 | 14 | University of Washington at Seattle (Michael G. Foster School of Business) | 148 | 68.51 | USA | 87 | 0.78747126 |
| 7 | 5 | University of Texas at Dallas (Naveen Jindal School of Management) | 167 | 79.89 | USA | 104 | 0.76817308 |
| 8 | 27 | Cornell University (Samuel Curtis Johnson Graduate School of Management) | 126 | 53.75 | USA | 70 | 0.76785714 |
| 9 | 17 | University of North Carolina at Chapel Hill (Kenan-Flagler Business School) | 149 | 62.8 | USA | 83 | 0.75662651 |
| 10 | 23 | Washington University at St. Louis (Olin School of Business) | 123 | 56.67 | USA | 76 | 0.74565789 |
| 11 | 6 | University of Chicago (Booth School of Business) | 157 | 78.44 | USA | 109 | 0.71963303 |
| 12 | 12 | Massachusetts Institute of Technology (Sloan School of Management) | 152 | 71.23 | USA | 99 | 0.71949495 |
| 13 | 15 | University of Minnesota at Twin Cities (Carlson School of Management) | 159 | 66.32 | USA | 94 | 0.70553191 |
| 14 | 11 | University of Michigan at Ann Arbor (Ross School of Business) | 148 | 71.92 | USA | 103 | 0.69825243 |
| 15 | 21 | Ohio State University (Fisher College of Business) | 134 | 57.96 | USA | 84 | 0.69 |
| 16 | 10 | INSEAD (School of Business) | 164 | 72.92 | France | 106 | 0.68792453 |
| 17 | 45 | University of Georgia (Terry College of Business) | 84 | 35.71 | USA | 52 | 0.68673077 |
| 18 | 62 | Rice University (Jesse H. Jones Graduate School of Business) | 52 | 26.56 | USA | 39 | 0.68102564 |
| 19 | 2 | New York University (NYU) (Leonard N Stern School of Business) | 205 | 94.17 | USA | 139 | 0.67748201 |
| 20 | 89 | Indian School of Business (ISB) (School of Business) | 51 | 18.96 | India | 28 | 0.67714286 |
| 21 | 16 | University of Maryland at College Park (Robert H. Smith School of Business) | 153 | 65.8 | USA | 99 | 0.66464646 |
| 22 | 30 | Carnegie Mellon University (Tepper School of Business) | 99 | 49.9 | USA | 76 | 0.65657895 |
| 23 | 55 | Dartmouth College (Tuck School of Business) | 67 | 29.04 | USA | 45 | 0.64533333 |
| 24 | 41 | University of Colorado at Boulder (Leeds School of Business) | 77 | 36.92 | USA | 58 | 0.63655172 |
| 25 | 22 | University of California at Los Angeles (Anderson School of Management) | 117 | 57.5 | USA | 92 | 0.625 |
| 26 | 38 | Purdue University (Krannert Graduate School of Management) | 85 | 40.06 | USA | 65 | 0.61630769 |
| 27 | 26 | University of London (London Business School) | 126 | 55.03 | United Kingdom | 91 | 0.60472527 |
| 28 | 47 | Georgia Institute of Technology (Scheller College of Business) | 75 | 34.55 | USA | 58 | 0.59568966 |
| 29 | 81 | University of California at San Diego (Rady School of Management) | 43 | 19.82 | USA | 34 | 0.58294118 |
| 30 | 13 | University of Texas at Austin (McCombs School of Business) | 151 | 71.03 | USA | 122 | 0.58221311 |
| 31 | 58 | University of Pittsburgh (The Joseph M. Katz Graduate School of Business) | 60 | 27.8 | USA | 48 | 0.57916667 |
| 32 | 24 | Pennsylvania State University at University Park (Smeal College of Business) | 121 | 55.51 | USA | 96 | 0.57822917 |
| 33 | 36 | University of Florida (Warrington College of Business) | 93 | 40.85 | USA | 71 | 0.57535211 |
| 34 | 28 | Texas A&M University at College Station (Mays Business School) | 133 | 52.81 | USA | 94 | 0.56180851 |
| 35 | 18 | University of Toronto (Joseph L. Rotman School of Management) | 141 | 62.71 | Canada | 112 | 0.55991071 |
| 36 | 9 | University of Southern California (Marshall School of Business) | 148 | 73.03 | USA | 136 | 0.53698529 |
| 37 | 50 | Yale University (School of Management) | 73 | 33.28 | USA | 62 | 0.53677419 |
| 38 | 44 | University of Notre Dame (Mendoza College of Business) | 75 | 35.78 | USA | 68 | 0.52617647 |
| 39 | 71 | University of Oregon (Charles H. Lundquist College of Business) | 51 | 23.38 | USA | 45 | 0.51955556 |
| 40 | 3 | Harvard University (Harvard Business School) | 173 | 87.05 | USA | 168 | 0.51815476 |
| 41 | 29 | Hong Kong University of Science and Technology (HKUST) (Business School) | 116 | 50.47 | China | 98 | 0.515 |
| 42 | 35 | Boston College (Carroll School of Management) | 83 | 43.03 | USA | 84 | 0.5122619 |
| 43 | 19 | Northwestern University (Kellogg School of Management) | 125 | 59.59 | USA | 117 | 0.50931624 |
| 44 | 65 | University of Cambridge (Judge Business School) | 66 | 25.82 | United Kingdom | 53 | 0.48716981 |
| 45 | 74 | University of Melbourne (Melbourne Business School (Incl. Faculty of Business & Economics)) | 59 | 22.13 | Australia | 46 | 0.48108696 |
| 46 | 20 | Indiana University at Bloomington (Kelley School of Business) | 134 | 58.64 | USA | 122 | 0.48065574 |
| 47 | 66 | University of Utah (David Eccles School of Business) | 59 | 25.73 | USA | 54 | 0.47648148 |
| 48 | 63 | Western University (Canada) / University of Western at London, Ontario (Ivey Business School) | 56 | 26.02 | Canada | 55 | 0.47309091 |
| 49 | 32 | Singapore Management University (Lee Kong Chian School of Business; Accountancy; Information Systems) | 112 | 47.95 | Singapore | 102 | 0.47009804 |
| 50 | 69 | City University London (Cass Business School) | 59 | 23.96 | United Kingdom | 53 | 0.45207547 |
| 51 | 39 | City University of Hong Kong (College of Business) | 105 | 38.62 | China | 86 | 0.44906977 |
| 52 | 51 | Temple University (The Fox School of Business and Management) | 74 | 33.11 | USA | 74 | 0.44743243 |
| 53 | 33 | Georgia State University (J. Mack Robinson School of Business) | 103 | 45.31 | USA | 102 | 0.44421569 |
| 54 | 34 | University of Illinois at Urbana-Champaign (Gies College of Business) | 100 | 44.35 | USA | 100 | 0.4435 |
| 55 | 43 | Boston University (Questrom School of Business) | 79 | 35.83 | USA | 81 | 0.44234568 |
| 56 | 25 | Arizona State University (W.P. Carey School of Business) | 138 | 55.33 | USA | 126 | 0.43912698 |
| 57 | 52 | University of South Carolina at Columbia (Darla Moore School of Business) | 72 | 31.04 | USA | 71 | 0.4371831 |
| 58 | 82 | University of Oxford (Said Business School) | 46 | 19.64 | United Kingdom | 45 | 0.43644444 |
| 59 | 48 | University of Wisconsin at Madison (Wisconsin School of Business) | 78 | 34.35 | USA | 79 | 0.43481013 |
| 60 | 86 | University of California at Irvine (Paul Merage School of Business) | 47 | 19.41 | USA | 46 | 0.42195652 |
| 61 | 46 | HEC Paris (School of Business) | 76 | 35.4 | France | 84 | 0.42142857 |
| 62 | 99 | University of Mannheim (Business School) | 31 | 15.86 | Germany | 38 | 0.41736842 |
| 63 | 57 | University of Arizona (Eller College of Management) | 74 | 27.92 | USA | 67 | 0.41671642 |
| 64 | 42 | University of British Columbia (Sauder School of Business) | 81 | 36.2 | Canada | 89 | 0.40674157 |
| 65 | 37 | National University of Singapore (NUS Business School) | 105 | 40.84 | Singapore | 104 | 0.39269231 |
| 66 | 64 | Bocconi University / Universita Bocconi (SDA School of Management (Inc. Finance, Marketing, Technology)) | 71 | 25.93 | Italy | 70 | 0.37042857 |
| 67 | 78 | Imperial College London (Imperial College Business School) | 56 | 20.53 | United Kingdom | 56 | 0.36660714 |
| 68 | 56 | McGill University (Desautels Faculty of Management) | 66 | 28.78 | Canada | 81 | 0.35530864 |
| 69 | 54 | Michigan State University (The Eli Broad College of Business) | 71 | 29.94 | USA | 86 | 0.34813953 |
| 70 | 70 | Emory University (Goizueta Business School) | 53 | 23.95 | USA | 69 | 0.34710145 |
| 71 | 67 | Georgetown University (The McDonough School of Business) | 61 | 24.8 | USA | 72 | 0.34444444 |
| 72 | 49 | Tilburg University ((TiSEM) School of Economics and Management (incl. Econometrics and Operation Research depts.)) | 84 | 34.04 | The Netherlands | 102 | 0.33372549 |
| 73 | 77 | Johns Hopkins University (Carey Business School) | 43 | 21.27 | USA | 64 | 0.33234375 |
| 74 | 84 | University of Arkansas at Fayetteville (Sam M. Walton College of Business) | 43 | 19.59 | USA | 60 | 0.3265 |
| 75 | 53 | Chinese University of Hong Kong (CUHK) (CUHK Business School) | 76 | 30.86 | China | 95 | 0.32484211 |
| 76 | 40 | Erasmus University (Rotterdam School of Management) | 93 | 37.41 | The Netherlands | 117 | 0.31974359 |
| 77 | 88 | University of Iowa (Henry B. Tippie College of Business) | 46 | 19.27 | USA | 61 | 0.31590164 |
| 78 | 95 | University at Buffalo / State University of New York (SUNY) at Buffalo (School of Management) | 37 | 16.52 | USA | 53 | 0.31169811 |
| 79 | 96 | University of Virginia, Darden (Darden School of Business) | 42 | 16.44 | USA | 53 | 0.31018868 |
| 80 | 73 | University of Hong Kong (Faculty of Business and Economics) | 60 | 22.72 | China | 75 | 0.30293333 |
| 81 | 98 | University of Kansas (School of Business) | 40 | 16.06 | USA | 55 | 0.292 |
| 82 | 79 | University of Alberta (School of Business) | 45 | 20.4 | Canada | 71 | 0.28732394 |
| 83 | 59 | Nanyang Technological University (Nanyang Business School) | 68 | 27.68 | Singapore | 101 | 0.27405941 |
| 84 | 68 | University of Miami (School of Business Administration) | 59 | 24.59 | USA | 92 | 0.26728261 |
| 85 | 85 | University of Connecticut (School of Business) | 48 | 19.44 | USA | 77 | 0.25246753 |
| 86 | 75 | University of Navarra (IESE Business School) | 52 | 21.8 | Spain | 88 | 0.24772727 |
| 87 | 61 | Hong Kong Polytechnic University (Faculty of Business) | 69 | 26.91 | China | 110 | 0.24463636 |
| 88 | 90 | University of Houston (C.T. Bauer College of Business) | 43 | 18.42 | USA | 82 | 0.22463415 |
| 89 | 83 | George Washington University (School of Business) | 39 | 19.61 | USA | 90 | 0.21788889 |
| 90 | 100 | Drexel University (Bennett S. LeBow College of Business) | 36 | 15.68 | USA | 72 | 0.21777778 |
| 91 | 80 | Northeastern University (D'Amore-McKim School of Business) | 54 | 20.15 | USA | 106 | 0.19009434 |
| 92 | 91 | Brigham Young University (Marriott School of Management) | 52 | 18.33 | USA | 97 | 0.18896907 |
| 93 | 60 | University of Warwick (Warwick Business School) | 59 | 27.46 | United Kingdom | 158 | 0.17379747 |
| 94 | 87 | Rutgers University at New Brunswick and Newark (Rutgers Business School) | 48 | 19.34 | USA | 120 | 0.16116667 |
| 95 | 92 | Tsinghua University (School of Economics and Management, Internet Industry) | 47 | 17.94 | China | 129 | 0.13906977 |
| 96 | 97 | Fudan University (School of Management) | 43 | 16.11 | China | 116 | 0.13887931 |
| 97 | 72 | Copenhagen Business School (School of Business) | 63 | 22.85 | Denmark | 207 | 0.11038647 |
| 98 | 76 | University of New South Wales (UNSW) (UNSW Business School) | 48 | 21.32 | Australia | 197 | 0.10822335 |
| 99 | 94 | City University of New York, Baruch College (Zicklin School of Business) | 44 | 17.4 | USA | 178 | 0.09775281 |
| 100 | 93 | Universite de Montreal / University of Montreal (HEC Montreal) | 41 | 17.92 | Canada | 217 | 0.08258065 |
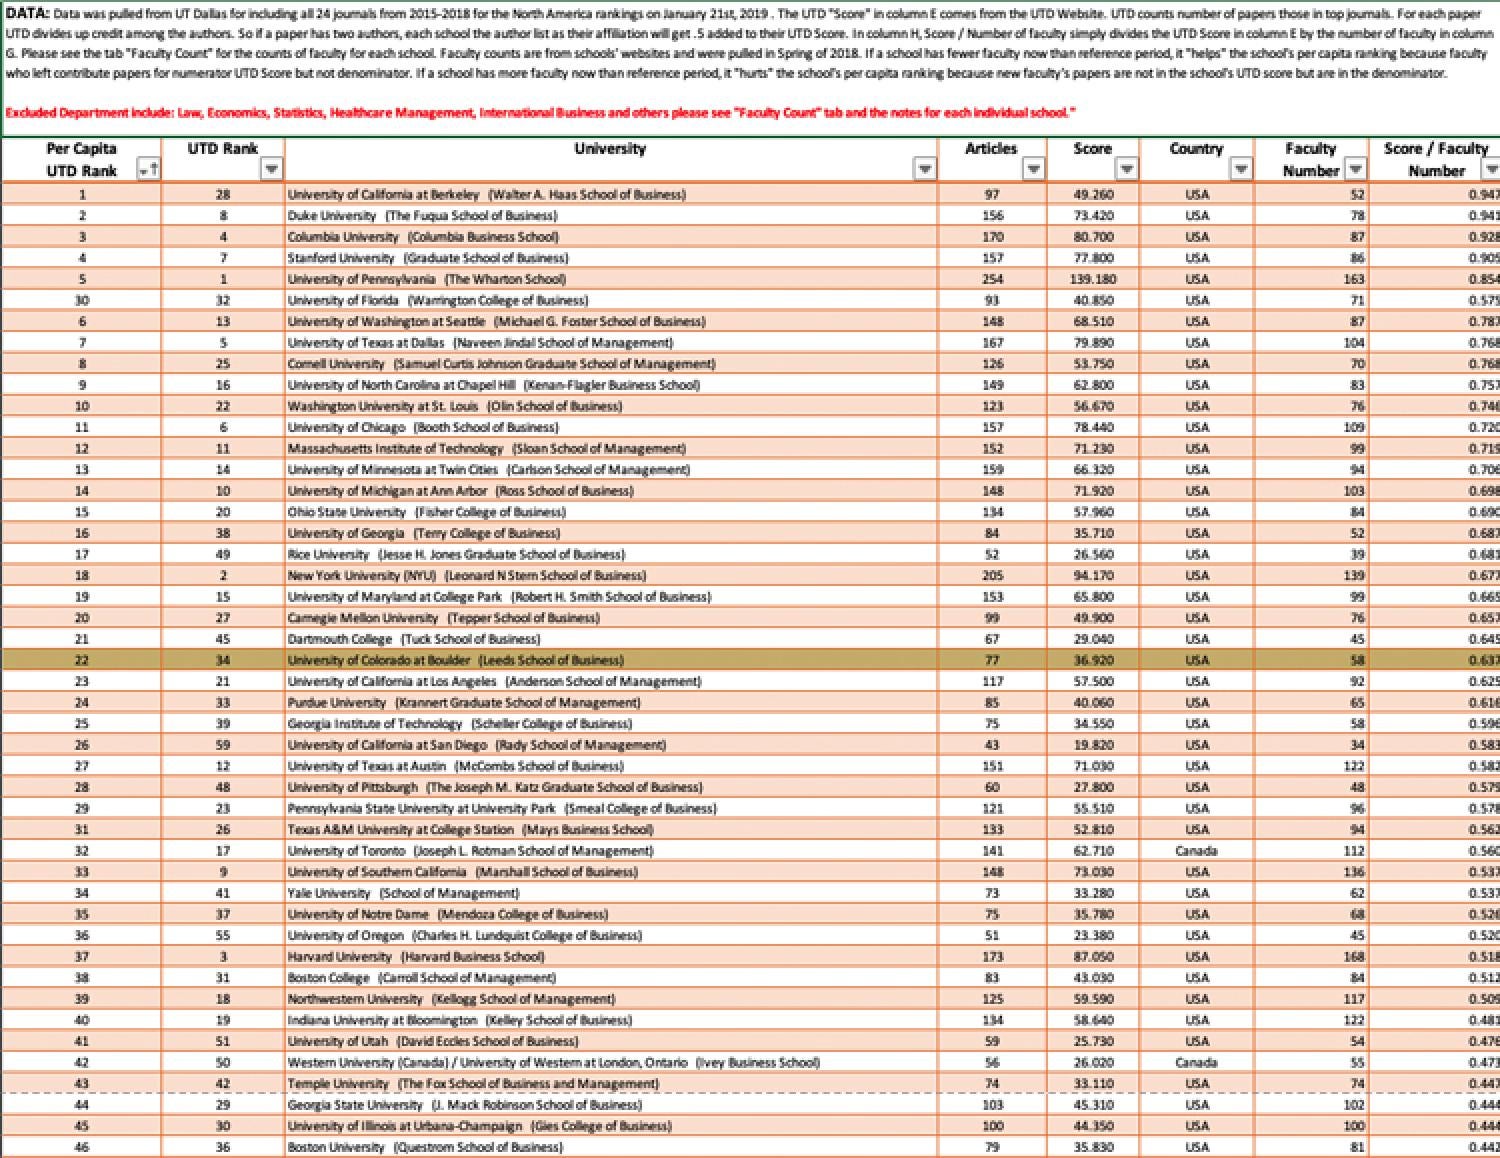
2015-2018 North America With Exclusions Rankings Report
DATA: Data was pulled from UT Dallas for including all 24 journals from 2015-2018 for the North America rankings on January 21st, 2019 . The UTD ""Score"" in column E comes from the UTD Website. UTD counts number of papers those in top journals. For each paper UTD divides up credit among the authors. So if a paper has two authors, each school the author list as their affiliation will get .5 added to their UTD Score. In column H, Score / Number of faculty simply divides the UTD Score in column E by the number of faculty in column G. Please see the tab ""Faculty Count"" for the counts of faculty for each school. Faculty counts are from schools' websites and were pulled in Spring of 2018. If a school has fewer faculty now than reference period, it ""helps"" the school's per capita ranking because faculty who left contribute papers for numerator UTD Score but not denominator. If a school has more faculty now than reference period, it ""hurts"" the school's per capita ranking because new faculty's papers are not in the school's UTD score but are in the denominator.
Excluded Department include: Law, Economics, Statistics, Healthcare Management, International Business and others please see ""Faculty Count"" tab and the notes for each individual school.
2015-2018 World Without Exclusions Rankings Report
DATA: Data was pulled from UT Dallas for including all 24 journals from 2015-2018 for the World rankings on January 21st, 2019 . The UTD ""Score"" in column E comes from the UTD Website. UTD counts number of papers those in top journals. For each paper UTD divides up credit among the authors. So if a paper has two authors, each school the author list as their affiliation will get .5 added to their UTD Score. In column H, Score / Number of faculty simply divides the UTD Score in column E by the number of faculty in column G. Please see the tab ""Faculty Count"" for the counts of faculty for each school. Faculty counts are from schools' websites and were pulled in Spring of 2018. If a school has fewer faculty now than reference period, it ""helps"" the school's per capita ranking because faculty who left contribute papers for numerator UTD Score but not denominator. If a school has more faculty now than reference period, it ""hurts"" the school's per capita ranking because new faculty's papers are not in the school's UTD score but are in the denominator.
No departments were excluded in this count all departments and faculty listed on school’s website were included.
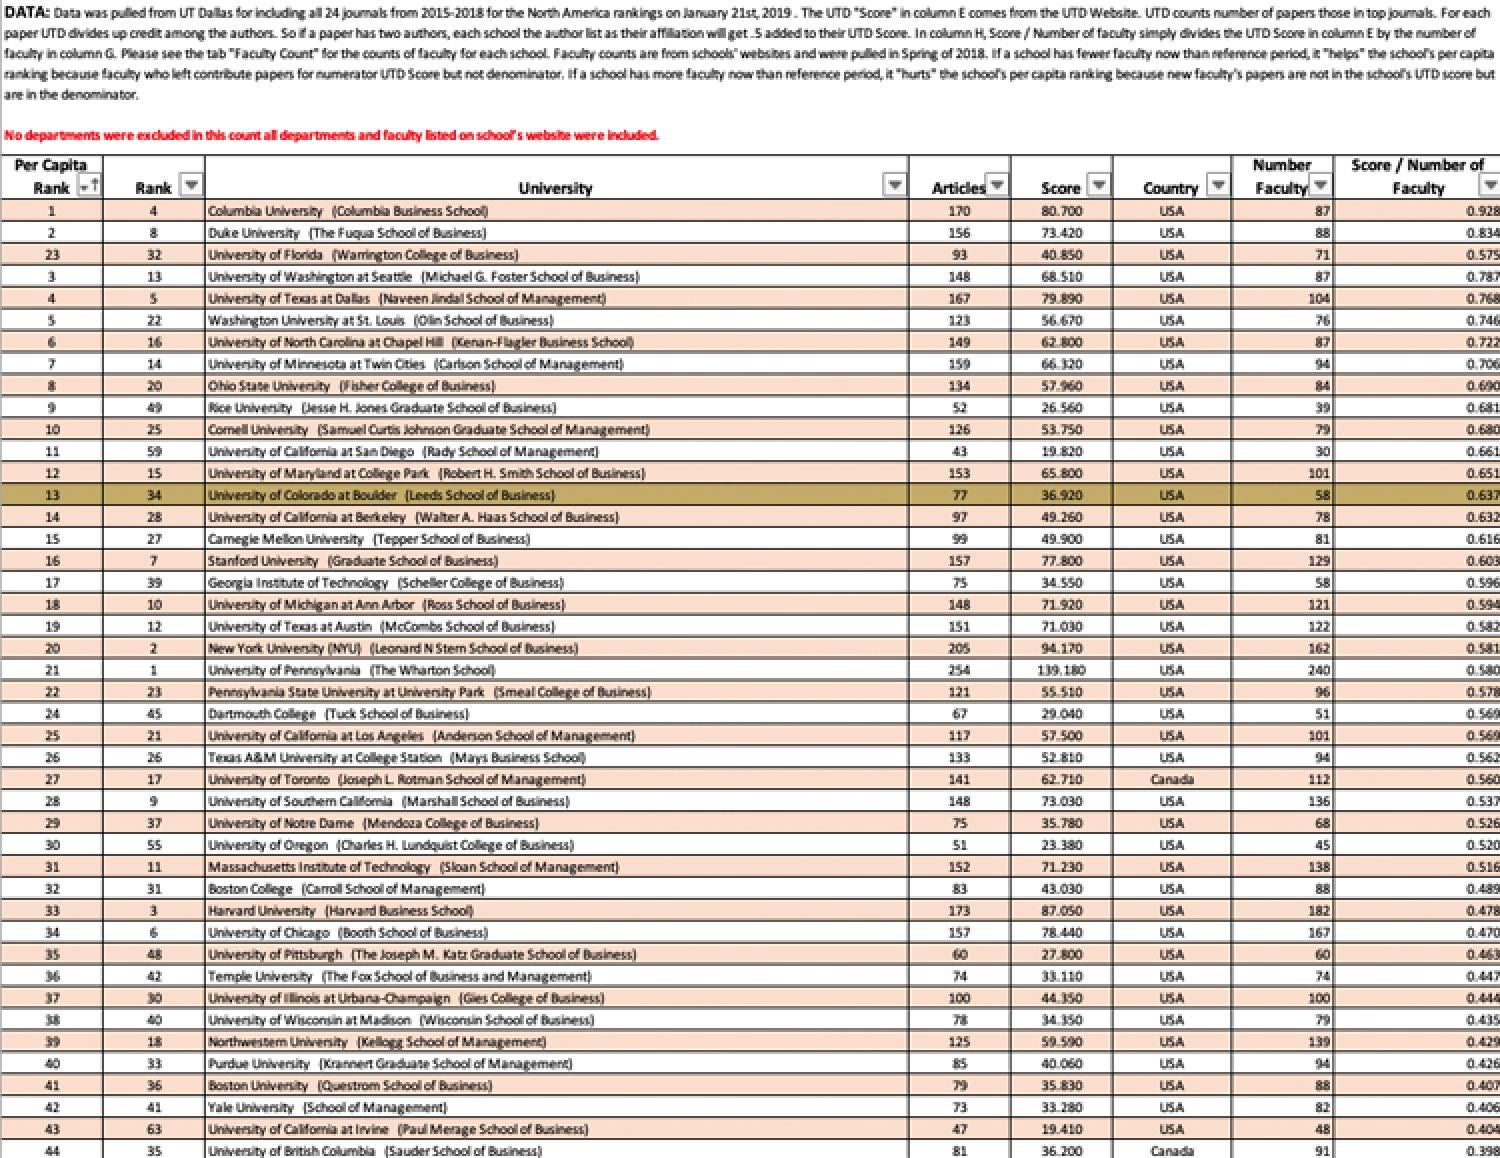
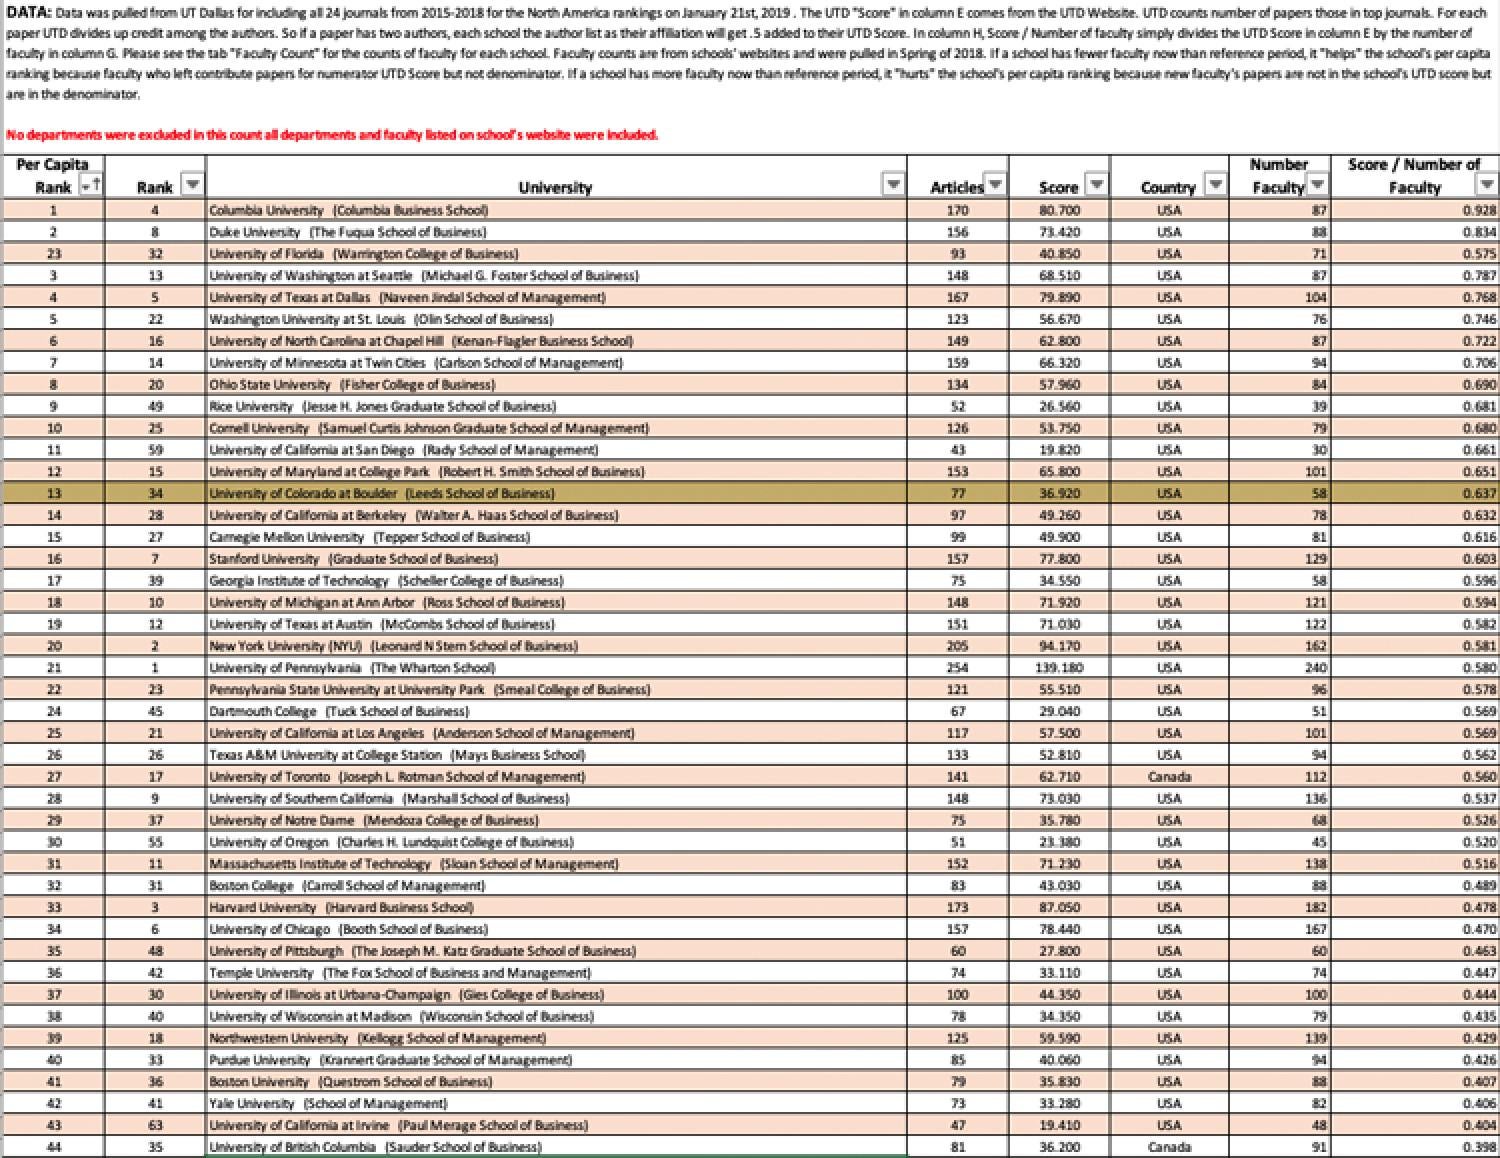
2015-2018 North America Without Exclusions Rankings Report
DATA: Data was pulled from UT Dallas for including all 24 journals from 2015-2018 for the North America rankings on January 21st, 2019 . The UTD ""Score"" in column E comes from the UTD Website. UTD counts number of papers those in top journals. For each paper UTD divides up credit among the authors. So if a paper has two authors, each school the author list as their affiliation will get .5 added to their UTD Score. In column H, Score / Number of faculty simply divides the UTD Score in column E by the number of faculty in column G. Please see the tab ""Faculty Count"" for the counts of faculty for each school. Faculty counts are from schools' websites and were pulled in Spring of 2018. If a school has fewer faculty now than reference period, it ""helps"" the school's per capita ranking because faculty who left contribute papers for numerator UTD Score but not denominator. If a school has more faculty now than reference period, it ""hurts"" the school's per capita ranking because new faculty's papers are not in the school's UTD score but are in the denominator.
No departments were excluded in this count all departments and faculty listed on school’s website were included.