Class of 2019 First Destination Employment Data by Specialization

COVID-19 Disclaimer:The impacts of COVID-19 have been felt far and wide by many. MENV’s Class of (December) 2019 graduated at a unique time, starting their job search at the beginning of a worldwide pandemic. As a result, the employment rate for Class of 2019 is significantly lower than previous years. For example, the employment rate for Class of 2018 was 89%, compared to the employment rate for Class of 2019, which was 76%. The MENV program seeks to provide complete and transparent employment data, which can be found below. Should you have any questions regarding these data, please do not hesitate to reach out to MENV’s Employer & Alumni Engagement Manager, Rachel Bigby at rachel.bigby@colorado.edu.


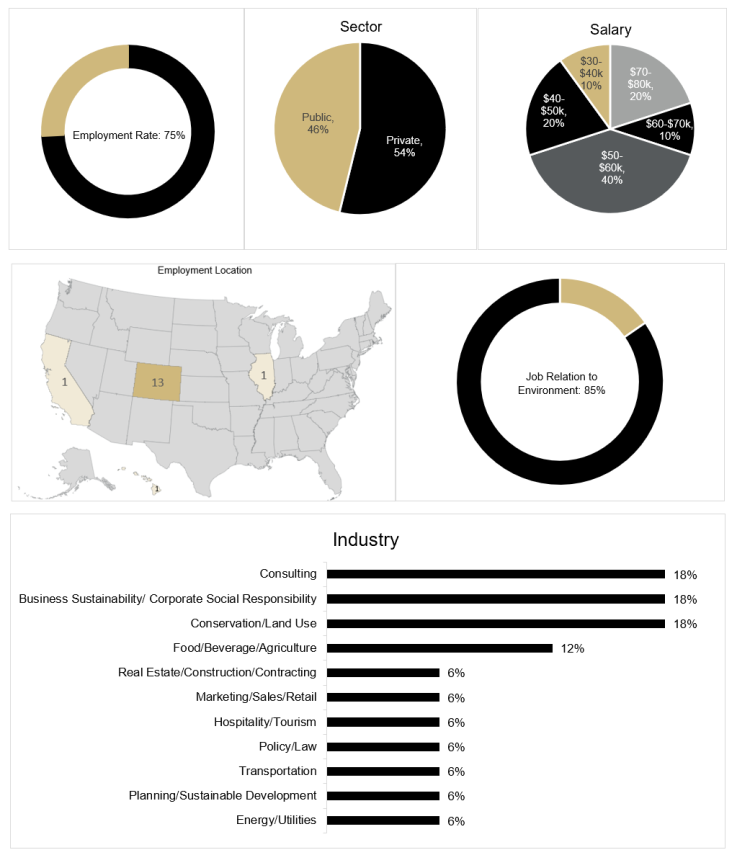
Environmental and Natural Resources Policy Specialization
graph of employment rate which is 70%, graph of employment by sector which is 28.5% private, 28.5% non-profit, 43% public, graph of salary distribution which is 14% prefer not to share, 71% $50,000 to $60,000, 14% $70,000 to $80,000, map of job locations, showing 6 in Colorado, 1 in Washington D.C., graph of job relation to environment which is 86%, and graph of employment by industry which is 33% conservation/land use, 33% planning/sustainable development, 17% policy/law, 17% consulting, 17% energy

 
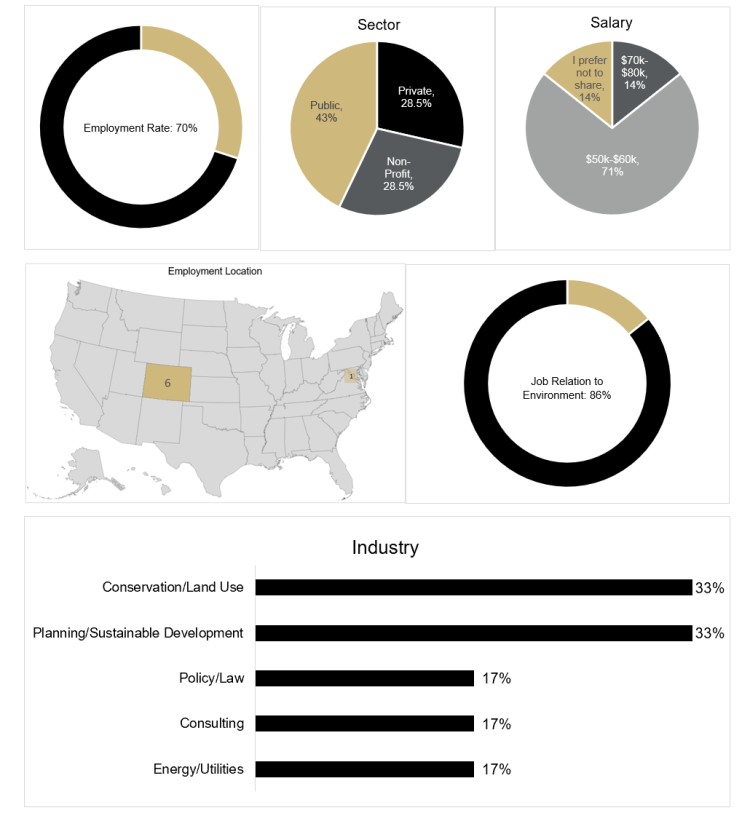
Renewable and Sustainable Energy Specialization

graph of employment rate which is 87%, graph of employment by sector which is 71% private, 29% non-profit, graph of salary distribution which is 29% $40,000 to $50,000, 14% $50,000 to $60,000, 14% $60,000 to $70,000, 43% $70,000 to $80,000, map of job locations, showing 7 in Colorado, graph of job relation to environment which is 100%, and graph of employment by industry which is 71% energy/utilities, 14% consulting, 14% research


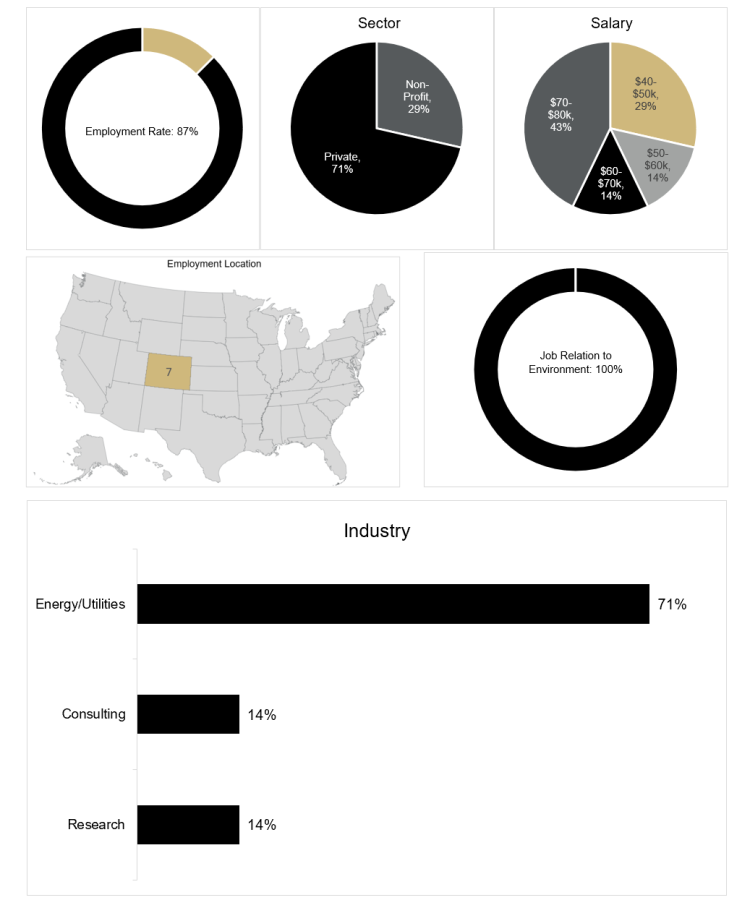
Sustainable Food Systems Specialization

graph of employment rate which is 57%, graph of employment by sector which is 67% private, 33% non-profit, graph of salary distribution which is 25% prefer not to share, 25% $50,000 to $60,000, 50% $60,000 to $70,000, map of job locations, showing 4 in Colorado, 1 in Idaho, graph of job relation to environment which is 100%, and graph of employment by industry which is 40% consulting, 20% tech/engineering/manufacturing, 20% real estate/contracting, 20% food/beverage/agriculture


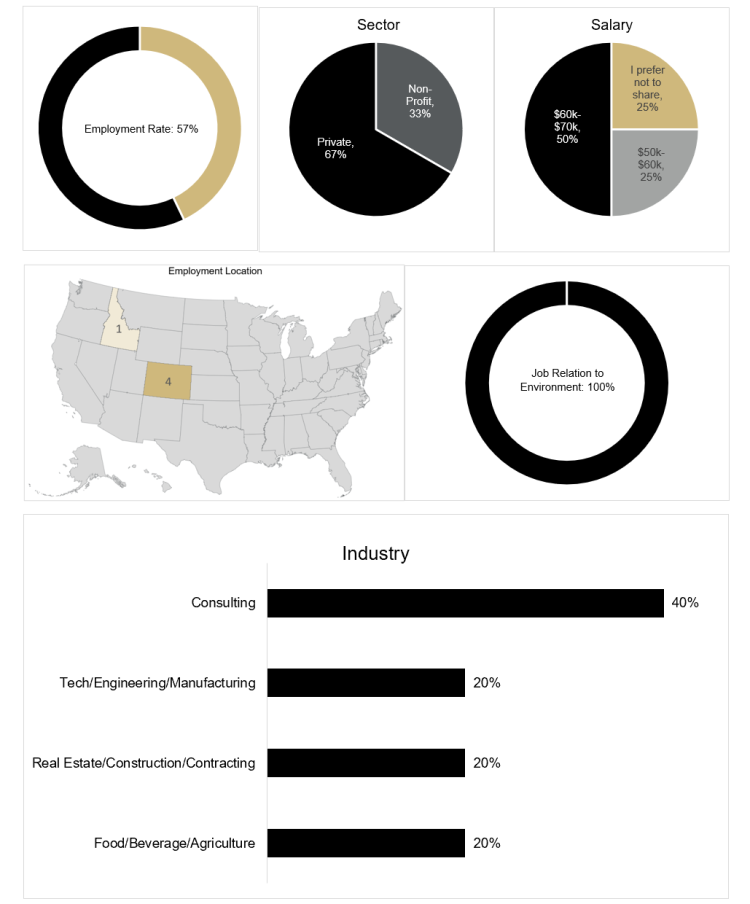
Urban Resilience and Sustainability Specialization

graph of employment rate of 75%, graph of employment by sector showing 54% private, 46% public, graph of salary distribution showing 10% $30k to $40k, 20% $40k to $50k, 40% $50k to $60k, 10% $60k to $70k, 20% $70k to $80k, map of job location showing 13 Colorado, 1 California, 1 Illinois, graph of job relation to environment showing 85%, graph of jobs by industry showing 18% consulting, 18% business sustainability, 18% conservation, 12% food/beverage, 6% real estate, 6% marketing, 6% hospitality, 24% other