
Facts & Figures
Enrollment Fall 2025
10,697
Total students
6,702
Undergraduates
2,893
Master's
1,084
Doctoral
Undergraduate Students Fall 2024
Race/Ethnicity
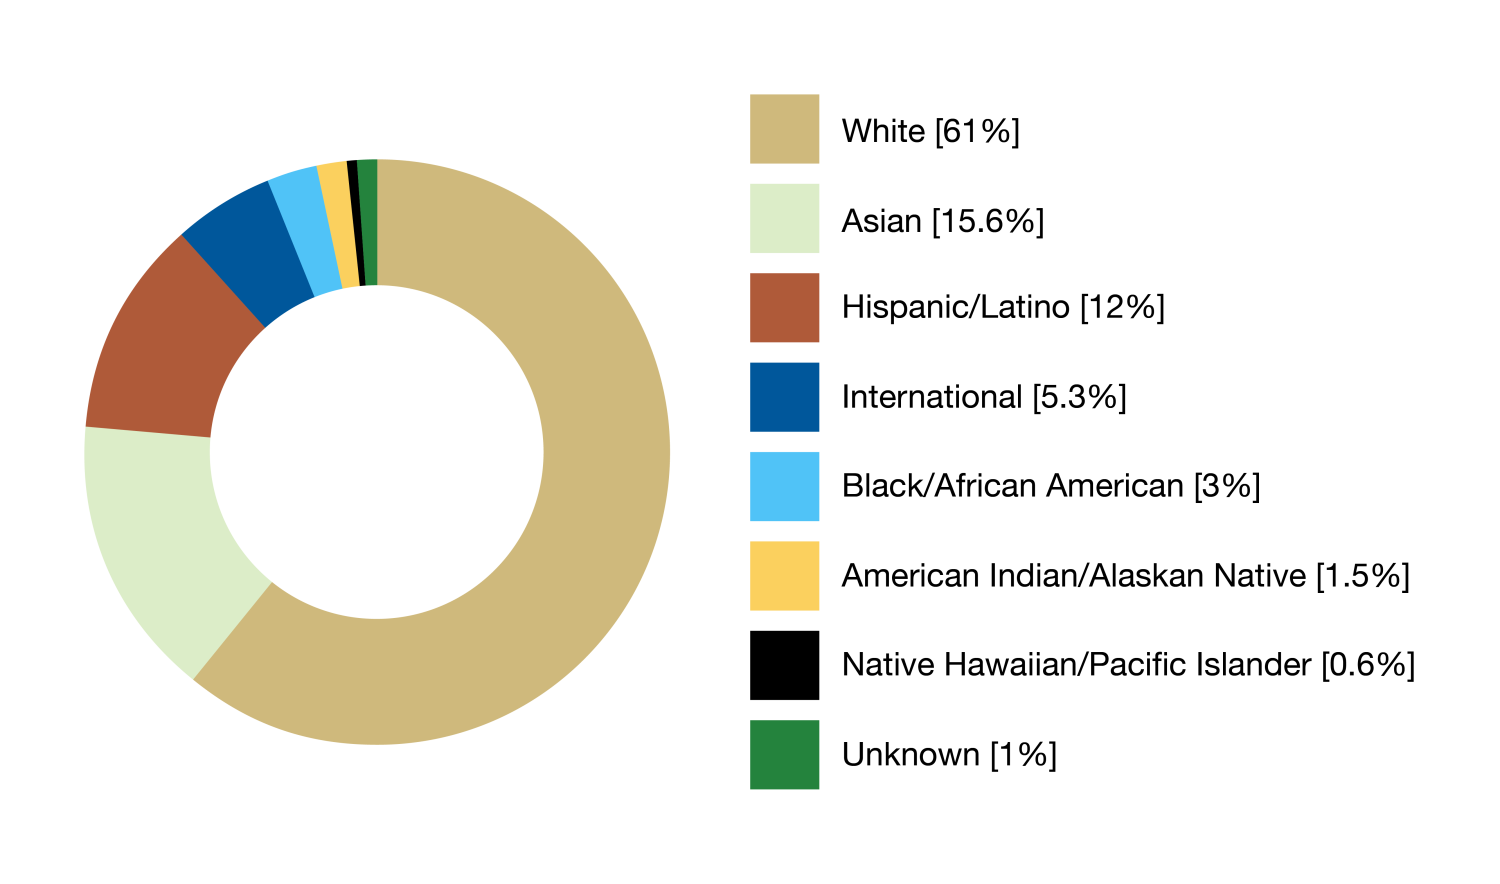
White [61%]
Asian [15.6%]
Hispanic/Latino [12%]
International [5.3%]
Black/African American [3%]
American Indian/Alaskan Native [1.5%]
Native Hawaiian/Pacific Islander [0.6%]
Unknown [1%]
Demographics
30%
Female*
70%
Male*
6%
International
12%
First-generation
17%
Historically underrepresented**
Undergraduate Retention
90%
Second fall retention rate in Engineering
73%
Graduation rate in Engineering within six years
64%
Historically Underrepresented Students*
Graduation rate in Engineering within six years
78%
Transfer Students
Graduation rate in Engineering within six years
*Most recent National Average 6-year graduation rate in Engineering is 61.7% (Median) for all students and below 50% for students from historically underrepresented backgrounds. (2018 American Society of Engineering Education Retention and Time-to-Graduation Survey)
Retention/Graduation Rate visualizations
Transfer Student Retention/Graduation Rate visualizations
Graduate Students Fall 2024
Graduate Race/Ethnicity
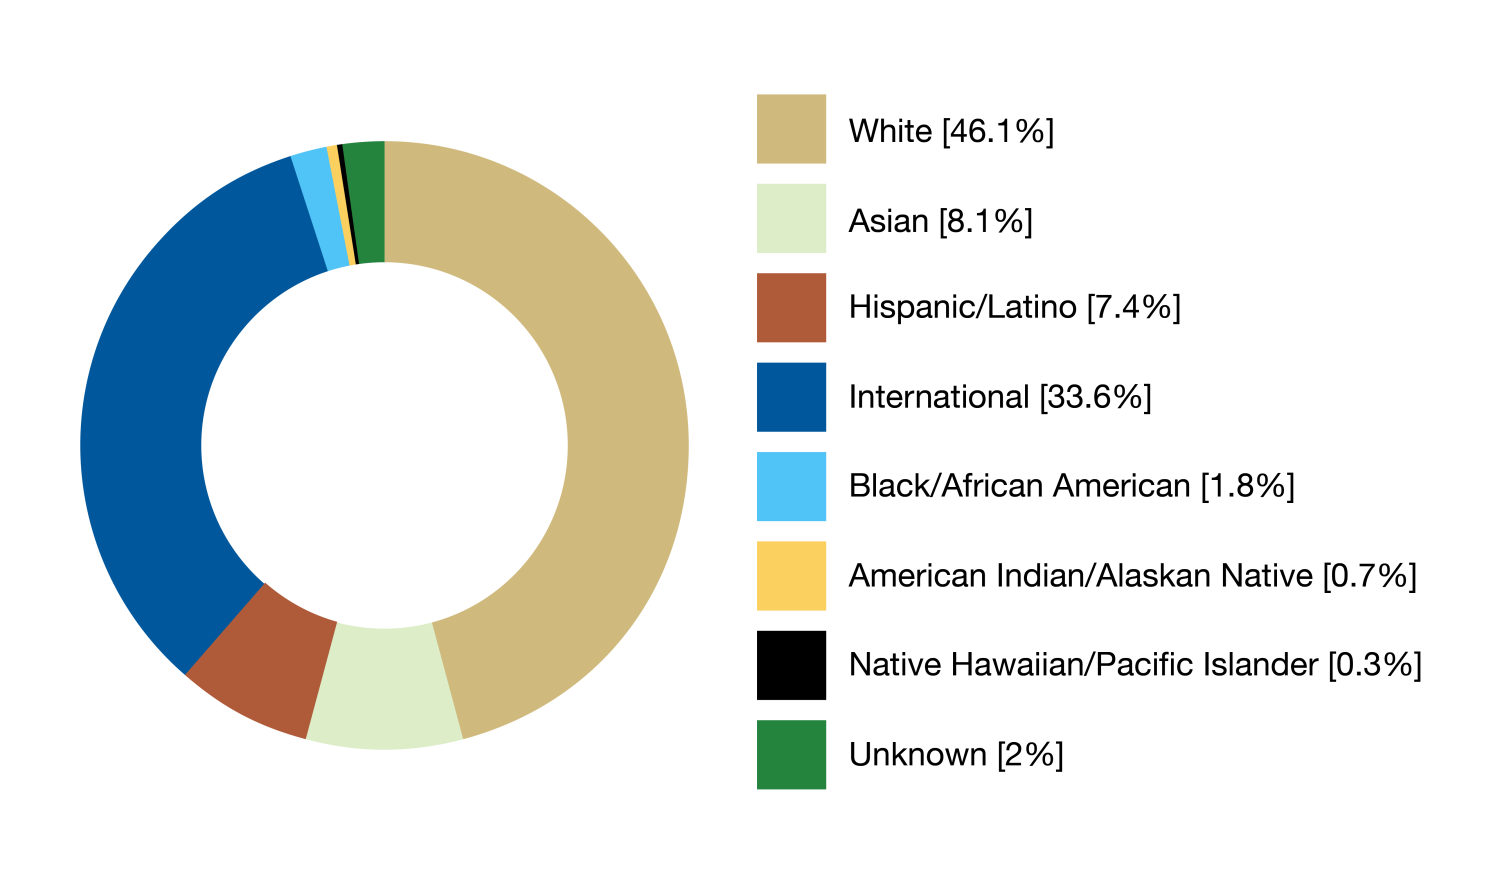
White [46.1%]
Asian [8.1%]
Hispanic/Latino [7.4%]
International [33.6%]
Black/African American [1.8%]
American Indian/Alaskan Native [0.7%]
Native Hawaiian/Pacific Islander [0.3%]
Unknown [2%]
Graduate Demographics
32%
Female*
68%
Male*
37%
International
9%
Historically underrepresented*
Research
5
Center-scale initiatives funded in 2022
10
National Academy members
$180 Million
Research Expenditures for FY 2023 (ASEE)
Top 10%
of Public Universities for Research Expenditures (ASEE, 2023)
Rankings
Undergraduate Public Rankings
U.S. News & World Report 2026 Best Undergraduate Engineering Programs
#15 Best Undergraduate Engineering Program
#6 Aerospace Engineering
#8 Environmental Engineering
#11 Chemical Engineering
#15 Civil Engineering
#14 Computer Science
Graduate Public Rankings
U.S. News & World Report 2026-27 Best Graduate Engineering Schools
#10 Best Graduate Engineering Schools
#5 Aerospace Engineering
#7 Environmental Engineering
#11 Chemical Engineering
#14 Computer Engineering
#14 Mechanical Engineering
#15 Computer Science (Best Computer Science Schools)
#15 Civil Engineering
#17 Electrical Engineering
#19 Biomedical Engineering
#20 Materials Science and Engineering
#26 Biological Engineering
The rankings, published annually by U.S. News and World Report, are based on a survey of more than 200 engineering schools nationwide that grant doctoral degrees. Specialty rankings are not available in all disciplines at the undergraduate level, and not all disciplines are ranked every year.
Faculty
250
Tenure track
faculty
105
Instructional
faculty
23:1
Undergraduate student
to faculty ratio
11:1
Graduate student
to faculty ratio
About the Data
Data Collection Values, Definitions and Limitations
In the College of Engineering and Applied Science, we strive to think critically about how to communicate data about our students, faculty and staff. We acknowledge that our collection methods are limited, and we may not have data to represent all identities within our diverse community. As often as possible, we will disaggregate our data to better understand the variation of experiences within our college and the university. To ensure that data is not identifiable, we will not share data on groups with fewer than 10 students where data could be attributed to a specific person. Statistically, methods for analyzing small populations are limited, but it is important to not disregard them. We utilize this data internally, although it may not be published.
As of Jan. 30, 2020, in alignment with Colorado driver license and identification card policies, CU Boulder systems include three sex designations: male (M), female (F) and nonbinary (X). CU Boulder recognizes that your legal information doesn't always align with how you identify. To foster diversity, equity and inclusion, CU systems allow you to indicate your gender identity, name pronunciation, preferred name, pronouns and/or sexual orientation within the Buff Portal. We are currently limited in the data that we can report because the information in the student portal may not be complete (data is self-reported and optional to report). For more information visit the Office of the Registrar. While the unique identities of our students, faculty and staff may not always be reflected in the data we have available, we seek to acknowledge and support all community members and to continue improve our data collection efforts.
Student demographic information initially comes from the Common Application that a student submits when they apply for admission. The Common Application includes Hispanic/Latino, American Indian or Alaska Native, Asian, Black or African American, Native Hawaiian or Other Pacific Islander, and White (including Middle Eastern) as race/ethnicity options. At this time the demographic information we are able to report on is limited to these categories.
While the unique identities of our students, faculty and staff may not always be reflected in the data we have available, we seek to acknowledge and support all community members and to continue improve our data collection efforts.
We strive to use terms that the people in our community self-identify with whenever possible. We acknowledge that the term “underrepresented minority” is not a term that students, faculty or staff generally use to identify themselves. We use this term to compare our data to national data on STEM education when disaggregated data by race/ethnicity is not available. Acronyms and terms can be convenient when describing data, but they are imperfect and problematic at times. We strive to use person-first language and to understand the unique experiences of individual students and groups. We are always open to feedback from our community as we continue to learn more and enhance the experience for all students, faculty and staff.
The Campus Workplace and Culture Survey will be distributed to all students, faculty and staff in fall 2021 and will provide an opportunity to collect updated demographic data that will hopefully reflect the unique identities within our community. The university is committed to creating a welcoming environment that values respect, civility, and collegiality. The purpose of the Campus and Workplace Culture Survey is to gather information from CU Boulder students, staff, and faculty about their academic, workplace, and residential environments. We will use the results from this survey to better understand the existing culture of a college/department/program and to identify both strengths and areas of concern in order to make recommendations for creating and sustaining a welcoming and inclusive culture at CU Boulder.
For questions contact Vanessa Dunn, Director of Analytics, Assessment and Accreditation.