
Can math make redistricting more fair?
Banner image: To draw computer-generated maps of Colorado's potential political districts, Jeanne Clelland's software first pinpoints the hundreds of voting districts in the state, then connects them with lines to form borders. (Credit: Jeanne Clelland)
On the evening of Tuesday, Sept. 28, an independent, bipartisan commission voted to approve a new map for Colorado’s congressional districts––dividing the state into eight territories with roughly equal populations.
Colorado, like every other state in the Union, undergoes the process of reshaping its local and national voting districts every 10 years. You could fill a picture book with the convoluted, sometimes cartoonish shapes these regions take. Ohio’s fourth congressional district, for example, looks like a bit like duck, or maybe a dragon. Then there’s Illinois’ fourth, which political commentators often compare to earmuffs.
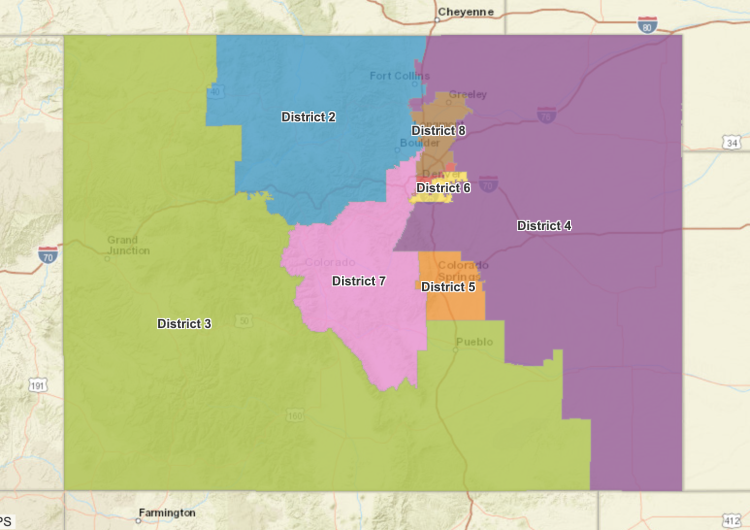
Final approved map for Colorado's eight congressional districts. (Credit: Colorado Independent Redistricting Commission)

An 1812 political cartoon depicts a newly drawn political district in Massachusetts as a salamander, which gave rise to the term "gerrymander." (Credits: Jeanne Clelland; public domain image via Wikimedia Commons)
Which is where Jeanne Clelland, a professor of mathematics at CU Boulder, enters the picture. She’s one of a growing number of researchers who are drawing on their skills to help inform the process of redistricting, bringing nonpartisan numbers to bear on this politically-fraught endeavor.
The risks come down to more than just funny shapes: Politicians have historically used redistricting as a chance to cut rivals out of power––and, in more insidious cases, to disenfranchise nonwhite voters. That American pastime, gerrymandering, gets its name from Massachusetts governor Elbridge Gerry, known for his cantankerous nature. In 1812, the staunch Democratic-Republican approved a map for his state that kneecapped opponents in the Federalist Party.
But math, Clelland said, can help.
“Litigation around redistricting has been going on for a long time, especially when it comes to racial gerrymandering,” Clelland said. “But it’s only in the last 10 years or so that mathematicians have started getting into the game.”
Clelland doesn’t advocate for any political party or for any particular redistricting proposal. Instead, she and her colleagues use mathematical models to build a series of redistricting statistics. These numbers give redistricting officials a baseline that they can compare their own maps to, potentially identifying cases of gerrymandering before they’re inked into law.
The topic has taken on new relevance this year. Colorado’s newly drawn congressional map is now off to the state Supreme Court for its final OK. A second independent commission is in the process of setting the borders for Colorado’s 35 General Assembly districts.
The mathematician’s team has released reports analyzing both of those redistricting processes. And, she said, the findings suggest these maps don’t seem to give any political party an unfair advantage in the state’s elections––at least for now.
“As far as I can tell, both commissions are acting in good faith and really trying to do the right thing,” she said. “There’s no way that everybody is going to be happy with the outcome, but we’ve got a good process in place, and I think the outcome will be fair.”
Coauthors on the new analyses include Beth Malmskog and Flavia Sancier-Barbosa of Colorado College and Daryl DeFord of Washington State University.
A bevy of maps
Clelland, who joined the CU Boulder faculty in 1998, discovered the field of redistricting math almost by accident at an academic workshop in 2017. She had previously studied more esoteric concepts in math like differential geometry and differential equations.
“I was looking for ways for me to use my professional skills to make a difference and improve the political landscape a little bit,” Clelland said. “This seemed like an opportunity for mathematicians to get involved and do good work.”
Jeanne Clelland
Here’s how it works: Clelland and her colleagues use computer software to dice Colorado up into as many potential district maps as possible––hundreds of thousands of maps in all. In doing so, they run through the full gamut of what Colorado’s voting landscape could theoretically look like in the next decade. They can also tweak those maps to favor some priorities over others.
“You can tell the computer, I want districts to be as politically competitive as possible, or I want districts to avoid dividing counties as much as possible,” Clelland said.
Clelland and her colleagues have presented their analyses to both independent commissions. She’s adamant that none of the team’s maps can, or should, set Colorado’s official district boundaries. But, she noted, they can give the independent commission a useful point of reference.
In other words, how do the results from a group of flawed humans stack up against the work of an unfeeling computer?
Keeping things fair
Say, for example, that Colorado voters turned out to the polls in 2022 and voted exactly like they did in recent statewide elections, such as for governor and secretary of state in 2018. In that scenario, Clelland’s hypothetical maps would produce about three or four Republican representatives and four or five Democratic representatives on average. Plenty of factors, from political scandals to wave elections, could tip those results toward either party. But, the mathematician said, if a redistricting map leaned too much toward a different outcome, it might be a sign that something was fishy.
“If somebody wanted to propose a plan that produced seven Democratic representatives, you’d say that plan may have some partisan bias in it,” Clelland said.
And, she said, the independent commission’s map seems to align well with her team’s results. That final proposal, for example, creates four districts that lean Democrat, three that tilt Republican––plus an eighth than is about as close to a toss-up as you can get.
For Clelland, a member of the League of Women Voters, the project is her chance to help Coloradans make their voices heard.
“As a pure mathematician, I’ve always enjoyed my research, but it’s kind of lousy for cocktail parties,” Clelland said. “Suddenly, I have research that people are excited to hear about.”