
Anyone can look up school data with new online tool
This story is adapted from news published by the Stanford Graduate School of Education. Read the original story here.
For the first time ever, a new online resource will give journalists, educators, parents and policymakers the chance to search through data on the academic performance of school kids across the country.
Called the Stanford Education Data Archive (SEDA), the new tool is the first comprehensive national database of its kind, the research team said. Benjamin Shear, an assistant professor in CU Boulder’s School of Education helped to develop the statistical methods underlying the new resource.
“This database reflects the School of Education’s core mission of promoting equity and evidence-based policy and practice.” Shear said. “The new interactive explorer is intended to make these data accessible to a wider audience, allowing them to explore educational opportunities in their own communities.”
The database, first made available online in 2016 in a format designed mainly for researchers, is built from 350 million reading and math test scores from 3rd to 8th grade students during 2008-2016 in every public school in the nation. It also includes district-level measures of racial and socioeconomic composition, segregation patterns, and other educational conditions.
The resource is an effort of the Educational Opportunity Project at Stanford University, which is led by Sean Reardon, a professor of poverty and inequality at the Stanford Graduate School of Education.
Researchers have used the massive data set over the past few years to study variations in educational opportunity by race, gender and socioeconomic conditions throughout the United States. The data have also shown that students’ early test scores do not predict academic growth over time, indicating that poverty does not determine the effectiveness of a school.
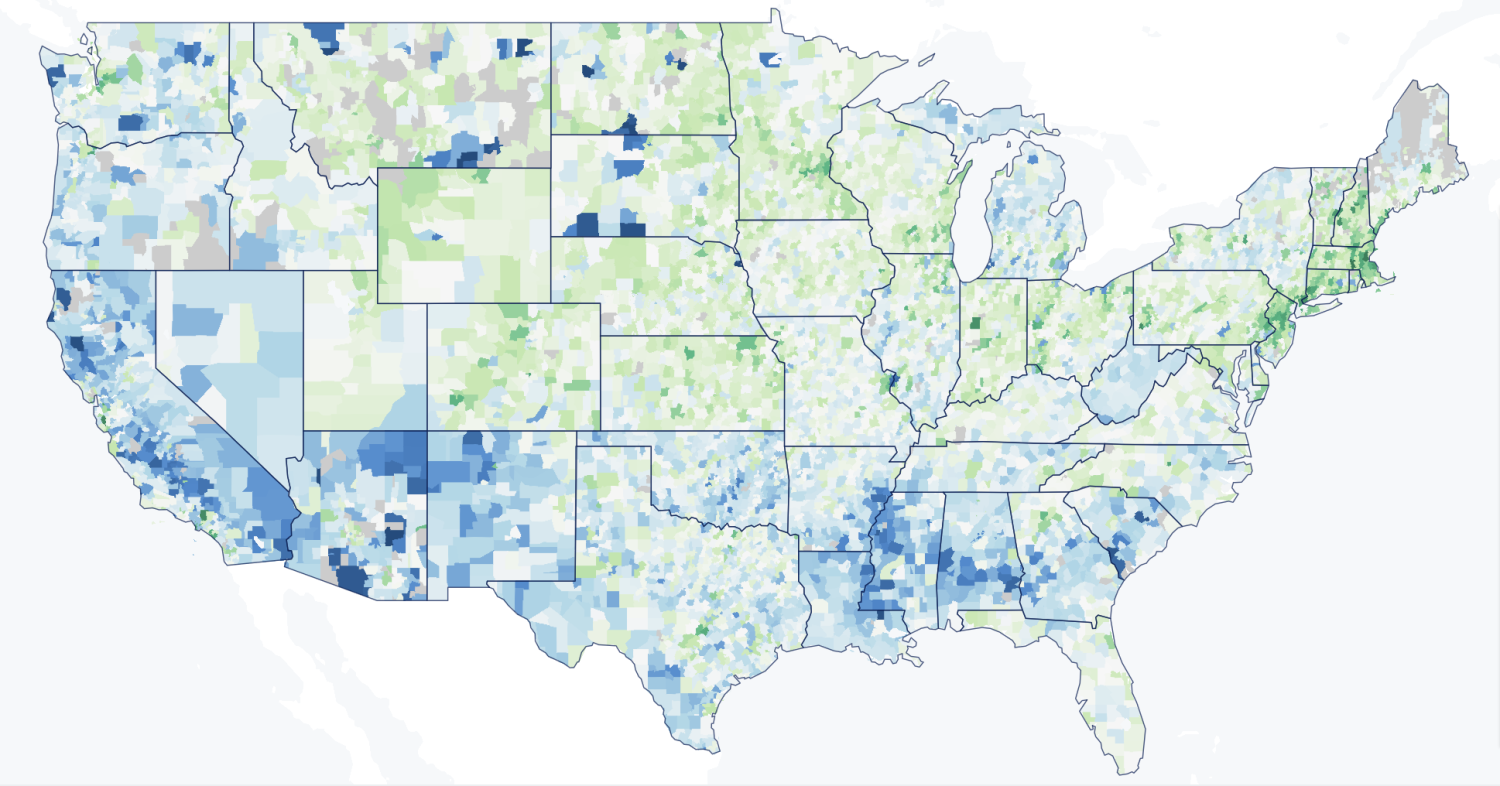
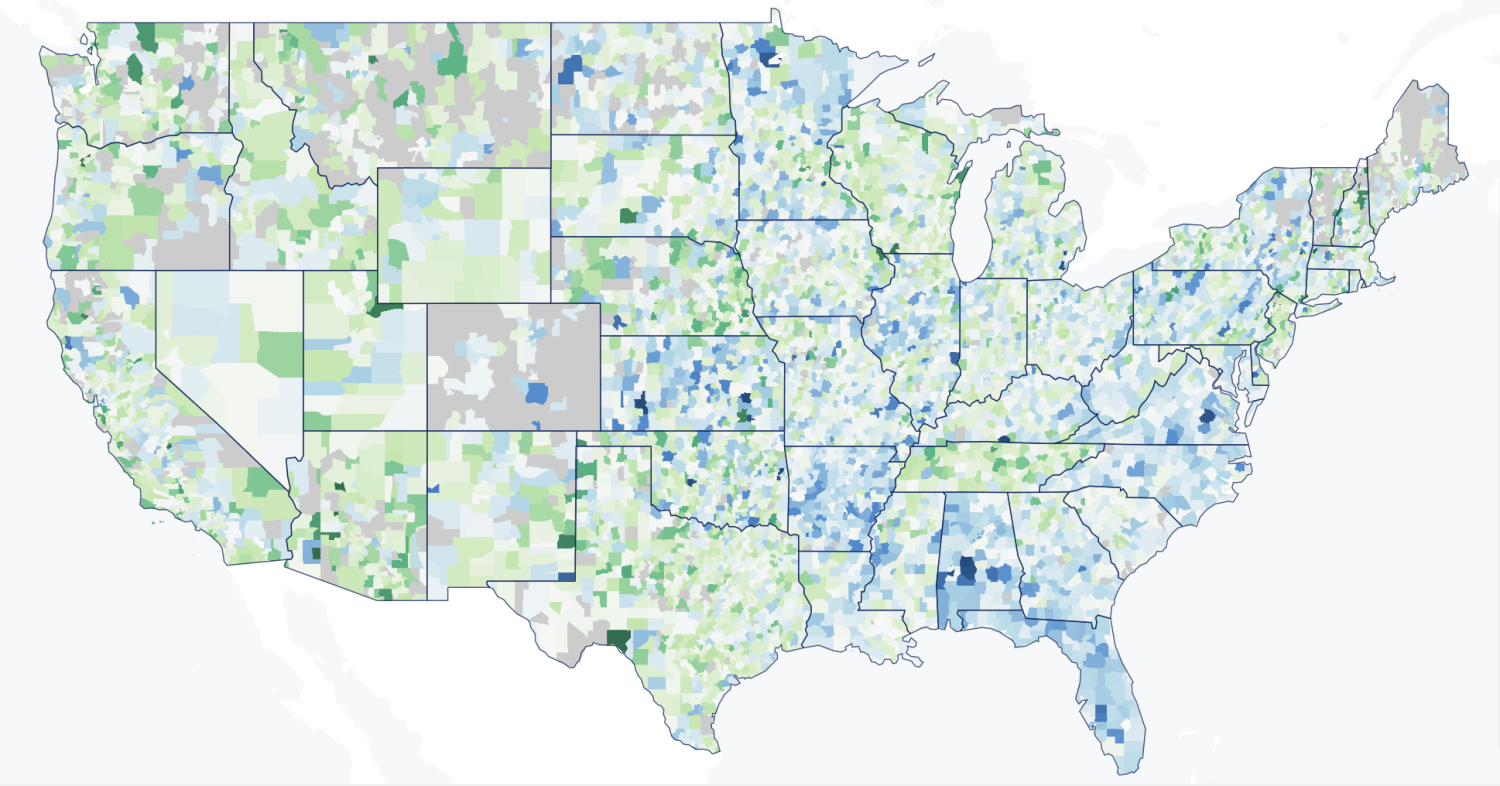
Now, with an interactive tool on the Educational Opportunity Project’s website, any user can generate charts, maps and downloadable PDFs to illustrate and compare data from individual schools, districts or counties. (Visualizations also can be embedded elsewhere online so that users can access them directly from another site.)
The site provides detailed data on three measures of educational opportunity:
- Average test scores
- Learning rates (how much students learn from one year to the next)
- Trends in how much average test scores change each year
“We can also break it down and look at how students are performing differentially by race, by ethnicity, by gender, by family income,” Reardon said. “That lets us understand not just how a community is providing opportunity for everyone, but whether it’s providing the same amount of opportunity for children from different backgrounds.”
Targeted solutions
The information on learning rates is a key innovation of the site, Reardon said, because these trends provide a picture of educational opportunity that’s vastly different from what average test scores show.
“Some states and websites provide some measure of learning rates for a community, but their data are typically based on one year of growth, and they aren’t comparable across states,” he said. “Our learning rates are based on eight years of data, so they’re much more reliable.”
And by indicating how much students learn as they go through school, these rates are “a much better measure of school quality,” Reardon said.
He acknowledged the limitations of measuring student achievement through reading and math scores. “Test scores certainly don’t measure everything we want for our kids,” he said. “We also want them to learn art and music, to learn to be empathetic and kind, creative and collaborative, and to have good friends and be happy—it’s not all about math and reading.”
But by pinpointing where disparities exist, where they’re getting worse or better and the factors that correlate with local trends, the Educational Opportunity Project aims to bring both researchers and community members closer to understanding how to create more equitable learning opportunities—in and out of school.
“The availability of the additional data files are intended to help researchers and policymakers identify areas of success and continuing need here in Colorado and in the U.S.,” Shear said.
Then, Reardon said, “we can get to a place where we can start to have targeted social and educational policy solutions that will really make a difference.”
The Educational Opportunity Project is supported by grants from the U.S. Department of Education’s Institute of Education Sciences, the Spencer Foundation, the William T. Grant Foundation, the Bill and Melinda Gates Foundation and the Overdeck Family Foundation.