
Submit original works to the student Data Visualization Contest
The University Libraries and the Center for Research Data & Digital Scholarship invite all CU Boulder students to submit their original works of data visualization by Dec.1 to be considered for prizes and displayed in Norlin Library.
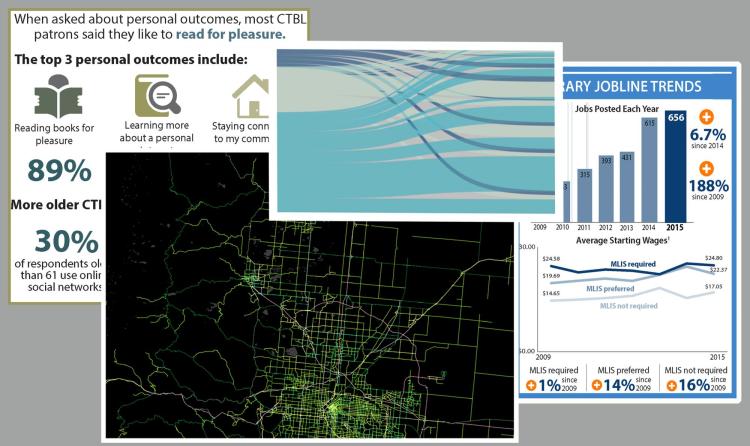
Collage illustrating different types of data visualization projects
The 2017 Data Visualization Contest is an opportunity for students to show off their visualizations and draw attention to their projects. Data visualizations may include everything from charts and graphs and data art to maps and 3-D models and can be static, animated or web-based interactive stories.
The Center for Research Data and Digital Scholarship will judge the submitted visualizations based on their ability to communicate insightful information, their overall design, technical merit and originality. Selected visualizations will be displayed in Norlin Library.
Prizes of $200, $100 and $50 will be awarded to the top three entries.
Rules and eligibility
The deadline for submission is Friday, Dec. 1, and the rules to enter are simple:
- You must be a CU Boulder student.
- Your visualization must have been created this year.
- You can only submit two entries.
Applicants will be required to submit a mini-essay detailing the insights you personally gained about the data during the visualization process (minimum 100 words) as well as a brief biography of each author (50 words maximum).
See the Data Visualization Contest entry form for more information on the required formating and to submit your entry. Questions? Email Earth Sciences & Environment Librarian Phil White at philip.white@colorado.edu.