
Research Highlight: The Effect of Heterogeneity on Hypergraph Contagion Models
Recently, Associate Professor Juan G. Restrepo and Applied Math PhD student Nicholas Landry published their work titled “The effect of heterogeneity on hypergraph contagion models” along with a press release.
Nicholas, who has been studying the dynamics of networks, and Prof. Restrepo wanted to look at the effects of social interactions on group dynamics when it comes to the spread of a contagion, which could be a rumor, meme, virus, or anything of that nature that can spread among groups. Furthermore, the pair of researchers wanted to look at the effect of the size of social groups on the tipping point of contagion flow. The tipping point is a critical point where the rate of spread of the contagion jumps up and becomes an epidemic. The distribution and variability of social interactions is critical for determining this tipping point, and this is precisely what was studied and outlined in the paper published.
In a Twitter thread on Nicholas’s page, he explains that “Contagion models are well-studied on pairwise networks, but lately, researchers have been interested in the effect of including group interactions. We know that often ideas or opinions can become viral or die out, depending on whether they reach a ‘critical mass’.” In their work, however, they apply this in a way to investigate how the heterogeneity of individual and group structure impacts the tipping point. “We looked at several different pairwise degree distributions and two different ways to connect nodes in groups of three.” In doing this, they discovered that with a more heterogeneous contact structure “in your individual connections makes tipping points less likely and more heterogeneity in the number of group connections tends to make tipping points more likely.”
In the future, they hope to extend their project by applying the model to real data and exploring the effect of other structural characteristics present in real world social networks.
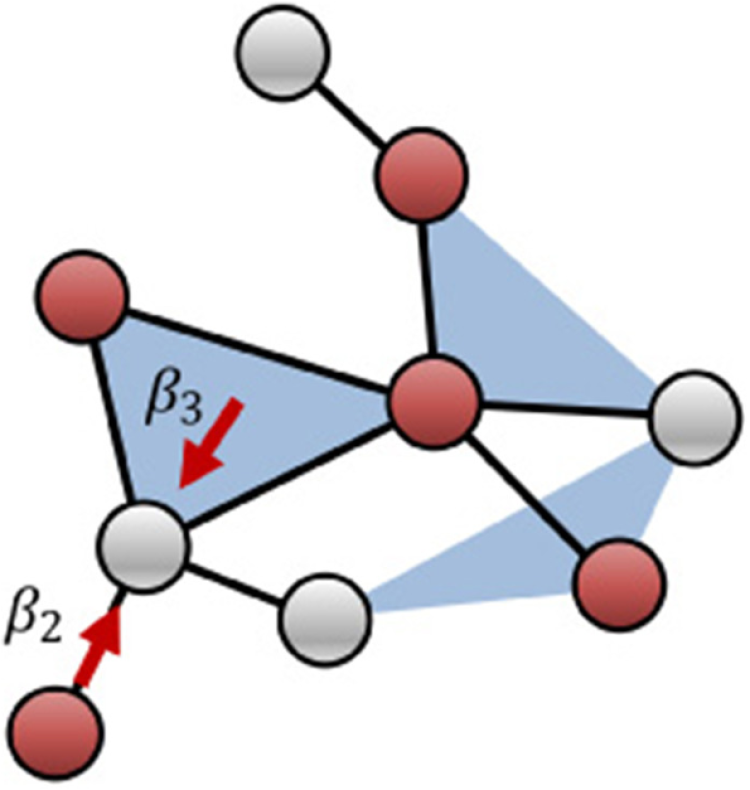
Illustration of a hypergraph. Infected nodes (red) infect a healthy node (gray)