
Scientific illustration & graphic design
Contact Eric Parrish for an initial consultation.
Discuss goals, strategy, & budget.
Review concepts & sketches.
Receive your custom graphic.
Your helper

Eric Parrish can help INSTAARs as well as individuals from other CU Boulder departments and institutes. He is a professional designer and illustrator with a background and career in research communication since 1997. He has worked extensively with the University of Colorado Boulder, especially for College of Arts and Sciences departments like EBIO, ATOC, and PSYC/NRSC as well as research institutes like INSTAAR and LASP. He has also contributed work to the Denver Museum of Nature and Science, and other regional museums. His work blends training in visual communication with subject matter expertise in Earth science, paleontology, and anthropology. He is also the author/co-author of multiple children's books on science. For an example, see the INSTAAR news story "New children’s book explores The Living Landscape."
News
- Proposal graphics are now supported at 50 percent through the Research & Innovation Office (RIO). Ask Eric about how he can help you create impactful graphics for your proposals at reduced cost. He also creates figures for papers, posters, presentations, exhibits, and outreach materials, with attention to accessibility and CU standards.
Initial consultation
Email Eric to schedule an initial consultation (via Zoom or in person). During the consultation, the two of you will discuss and agree about the project scope, timeline, and cost. Eric's focus for your graphics is to increase their clarity, impact, and audience engagement.
Costs & Payment
Cost varies by project complexity. Payment by CU Boulder SpeedType only.
- Typical complex project: $2500
- Minimum project: $250
Example graphic 1
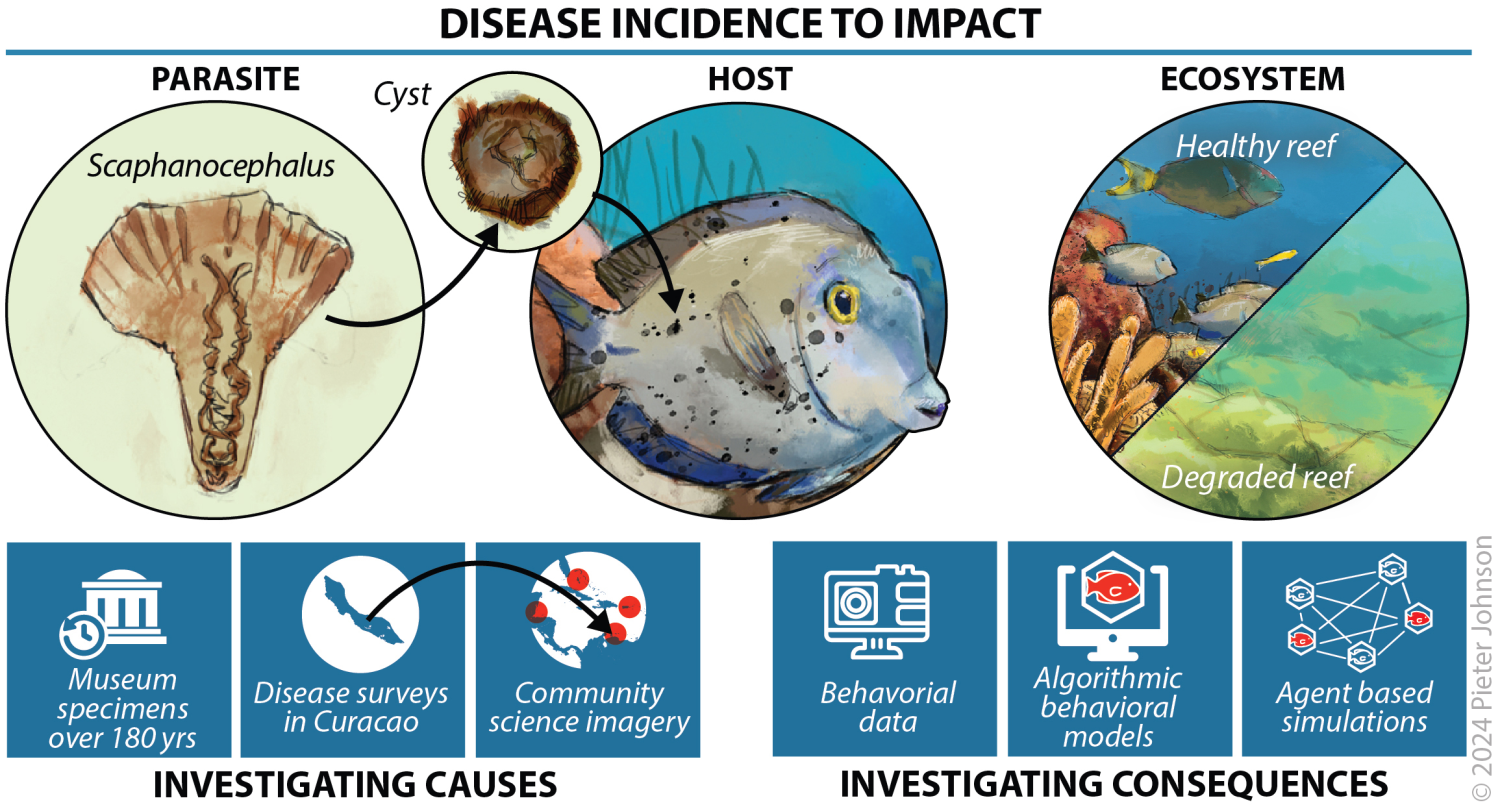
Eric created this conceptual diagram with Pieter Johnson, Professor of Ecology and Evolutionary Biology, CU Boulder. The diagram helps summarize one aspect of research on black spot syndrome in ocean surgeonfish.
Example graphic 2
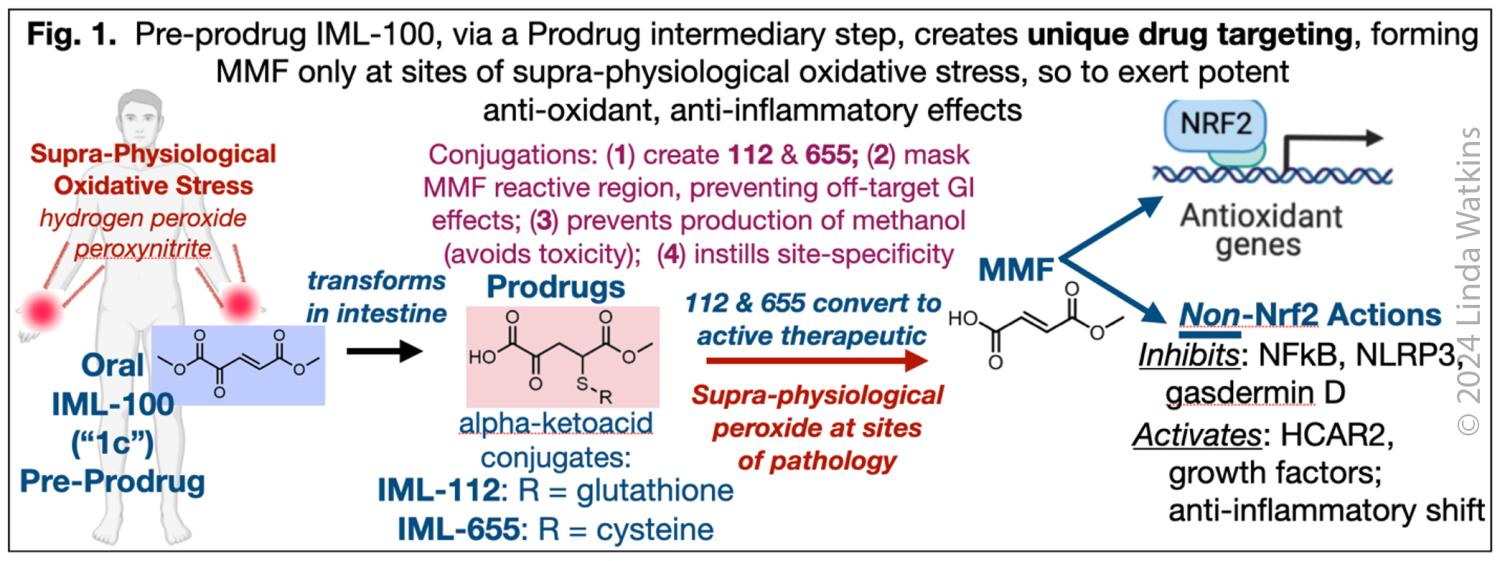
Before and after diagrams. The before diagram shows early ideas from Linda Watkins, Professor of Behavioral Neuroscience, CU Boulder. The after illustration is a more compelling and easier-to-understand diagram.
Before
After

Proposals, posters, & publications
Eric's graphics help make your proposals more competitive and posters/publications more impactful. He has created graphics for a wide range of needs, such as:
- Grant proposals (e.g., NSF, NIH, DOE, and NASA)
- Conference posters and museum displays.
- Publications (e.g., journal articles and annual reports).
- Media stories (e.g., newspapers, magazines, and websites).
- Museum Exhibits (e.g., CU Museum of Natural History).
Note that proposal graphics are supported at 50 percent through the Research & Innovation Office (RIO), reducing the cost to you.
Eric understands the expectations of journals commonly used by CU Boulder researchers and will tailor visuals to meet those standards—whether that means information-rich, publication-quality diagrams, multi-panel conceptual figures, or journal-specific graphics.
When appropriate, his graphics will meet branding guidelines for CU Boulder and other sponsors like NSF. And all his graphics are accessible (e.g., color contrast for color blindness, font size for visual impairment).
Stages and timeline
Most projects follow three stages:
- Initial consultation to define scope and goals.
- Preliminary concepts and drafts, followed by review and your approval.
- Final design and delivery (minor edits only at this stage).
Suggested lead time: 4–6 weeks ahead of your deadline.
| Project complexity | Estimated turnaround time |
|---|---|
| Simple project | 1–2 weeks |
| Intermediate | 2–3 weeks |
| Complex | 3–4 weeks |
| Large project | To be discussed |
Style options
Eric works in many styles. Here are three examples:
Hard line style
Hard line style graphic created for Michael Gil, Assistant Professor (EBIO), CU Boulder
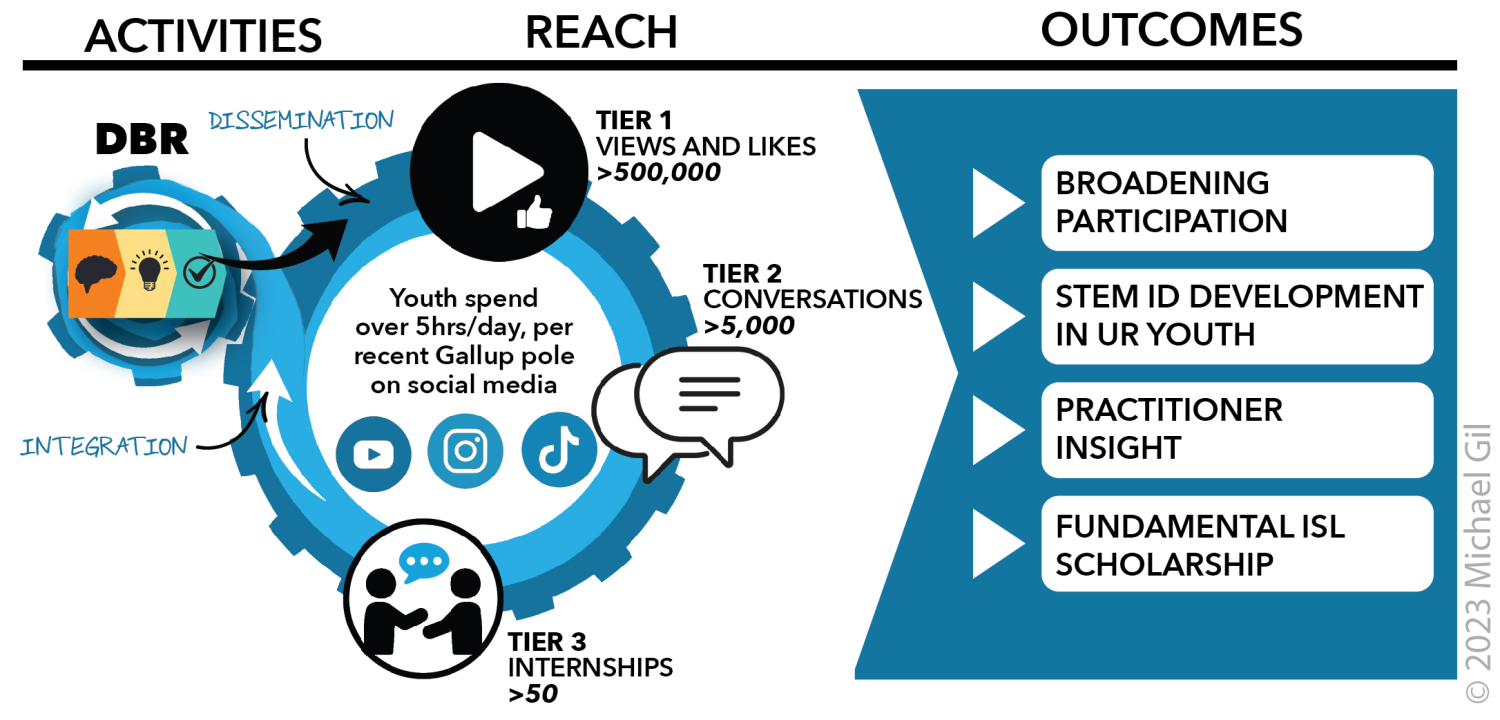
Illustration style
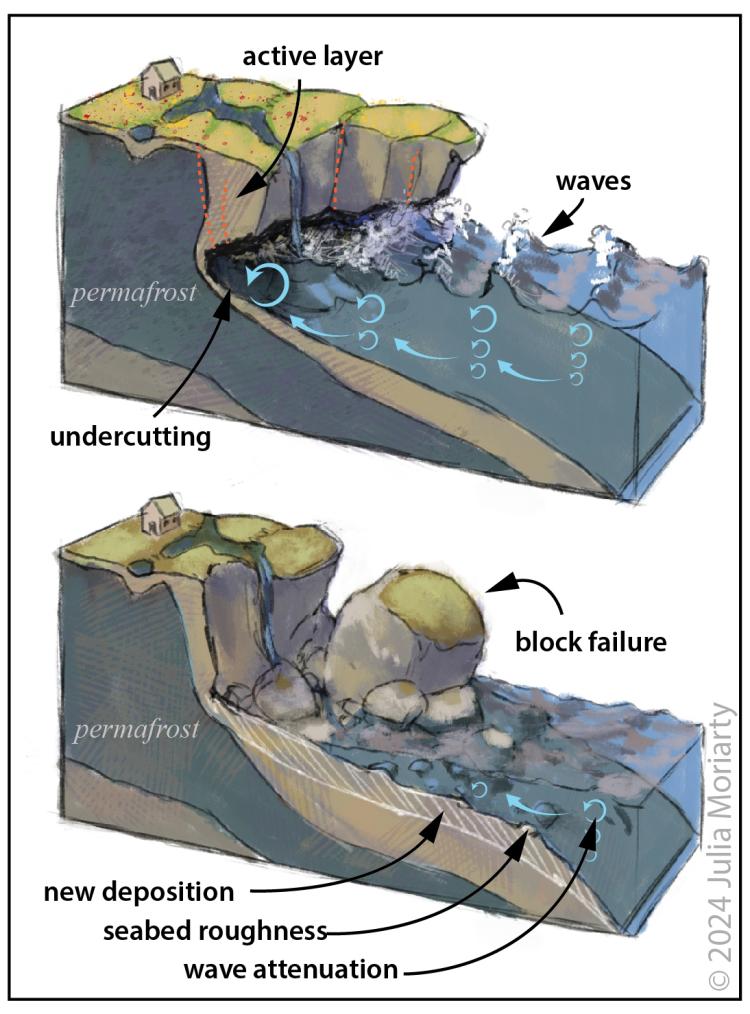
Illustration created for Julia Moriarty, Assistant Professor (ATOC + INSTAAR), CU Boulder
Hybrid style
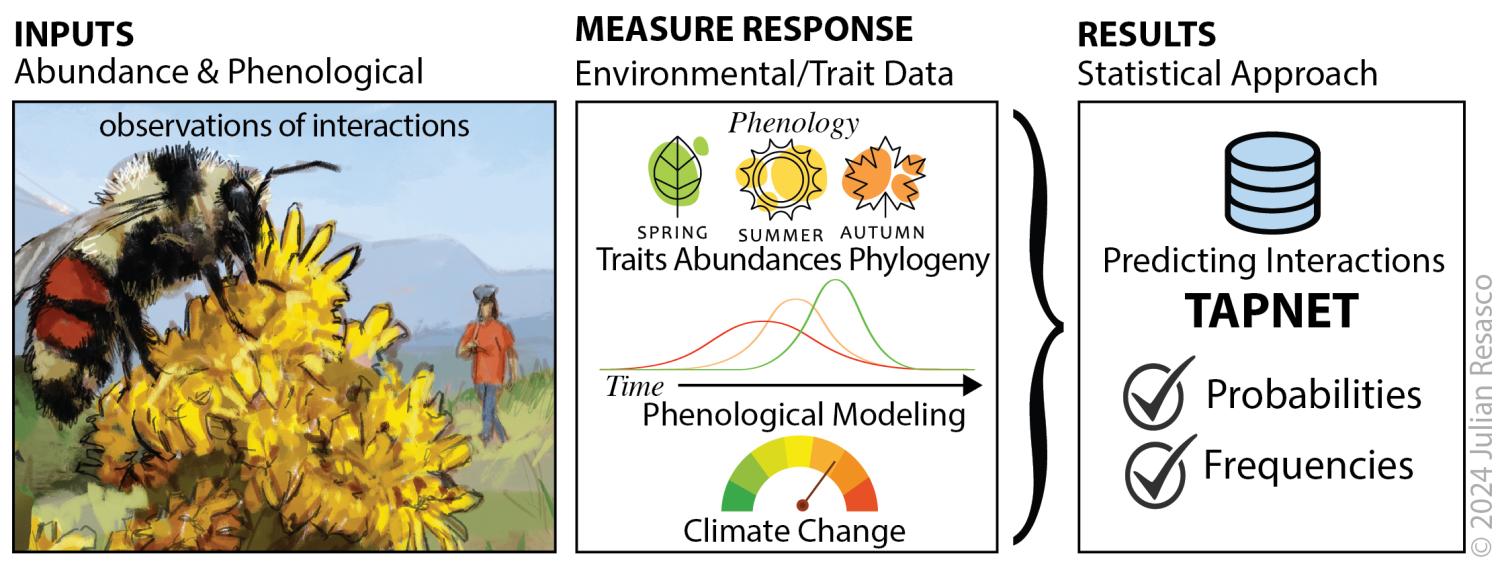
Hybrid graphic created for Julian Resasco, Assistant Professor (EBIO), CU Boulder
Do you work with INSTAAR or other CU Boulder unit?
Interested in new graphics for your proposal, poster, or publication?