
Ian Grooms Math Camp
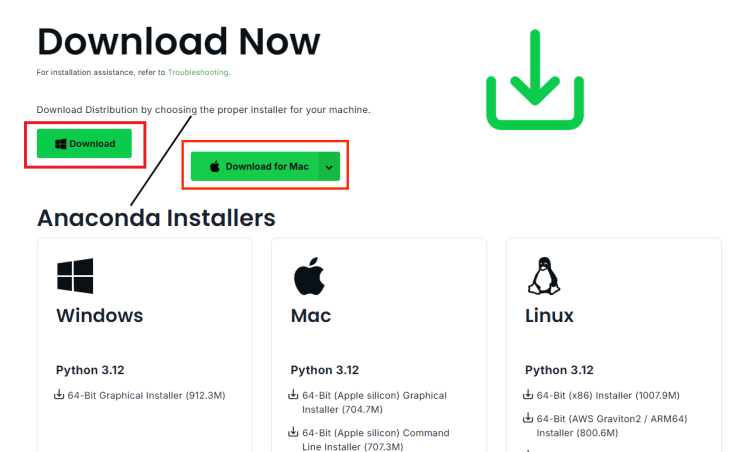
1. First go to https://www.anaconda.com/download and click Free Download

2. Click on the download button for your computer's OS
3. Run the installer


4.Choose to install for all users


5. (WINDOWS ONLY) Ensure that "Create Shortcuts" and "Register Anaconda3 as the system Python 3.12"

6. Wait for the installer to finish, this will take a few minutes and appear to freeze close to the end.


7. Open the Anaconda Navigator, once it loads, you will be prompted to update to the latest version.

8. Close Anaconda Navigator and allow the update

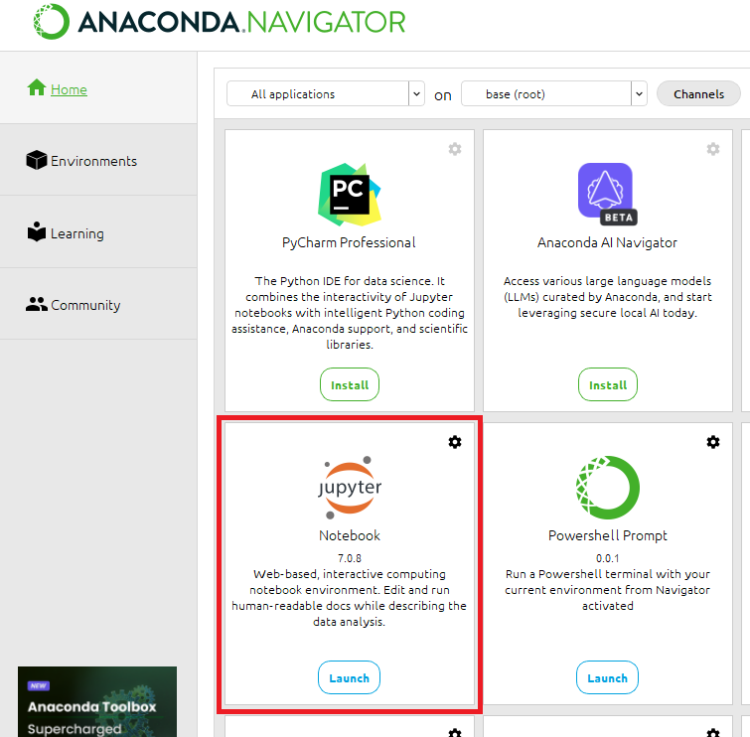
9. Re-open Anaconda Navigator and choose Jupyter Notebook
10. Go to File -> New -> Notebook
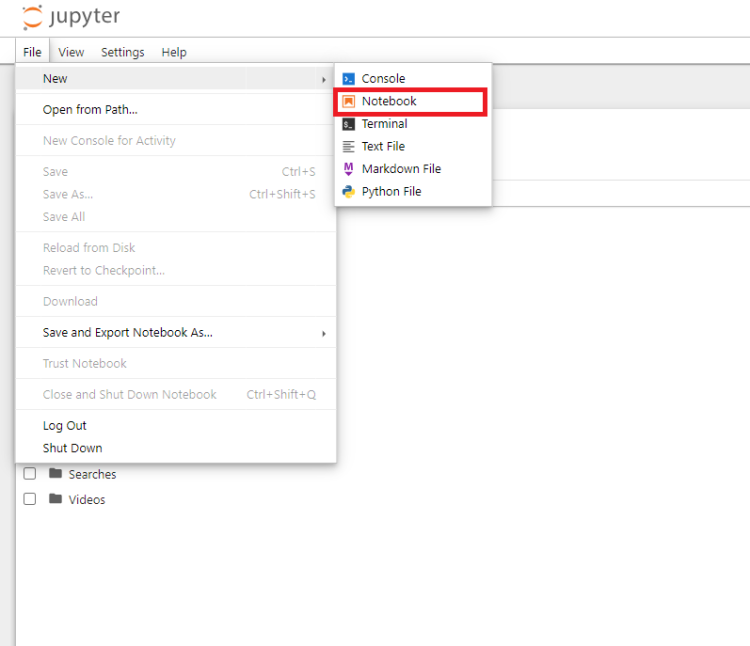
11. Select Python 3 (ipykernel)

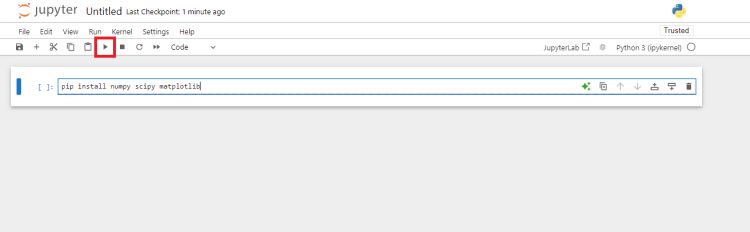
12. All on one line type in "pip install numpy scipy matplotlib" and then click the run button to install the plugins
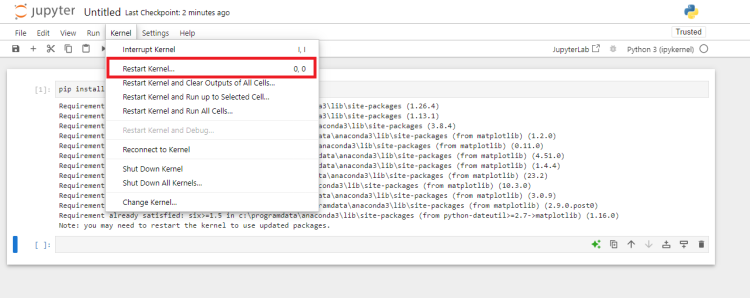
13. Restart the kernel, go to Kernel -> Restart Kernel...
14. Copy and paste the following code to test everything is running correctly:
import numpy as np
import scipy as sci
import matplotlib.pyplot as plt
a = np.arange(15).reshape(3, 5)
print(a)
print(sci.constants.c)
fig, ax = plt.subplots()
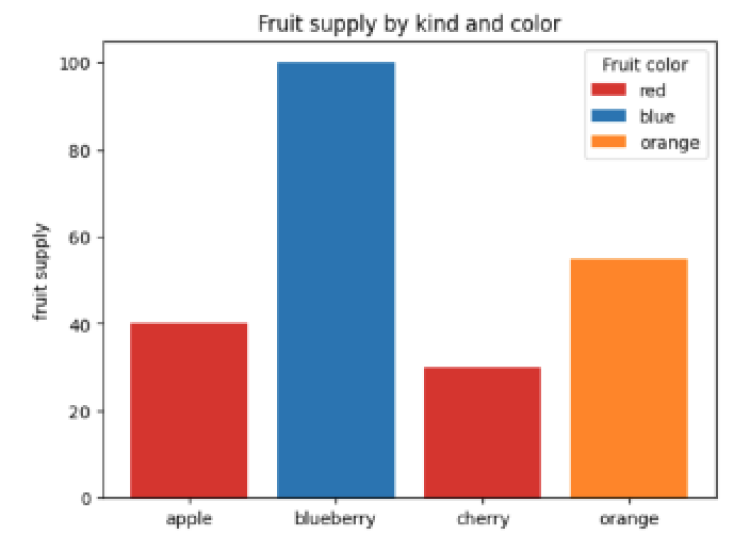
fruits = ['apple', 'blueberry', 'cherry', 'orange']
counts = [40, 100, 30, 55]
bar_labels = ['red', 'blue', '_red', 'orange']
bar_colors = ['tab:red', 'tab:blue', 'tab:red', 'tab:orange']
ax.bar(fruits, counts, label=bar_labels, color=bar_colors)
ax.set_ylabel('fruit supply')
ax.set_title('Fruit supply by kind and color')
ax.legend(title='Fruit color')
plt.show()
The result should look like this:
(Optional) For installing Mathmatica click here
Once everything is running run Ian's code here: https://github.com/iangrooms/Lin_Alg_Math_Camp/blob/main/Notebooks/Examples.ipynb