
Intermountain West SWE Reports
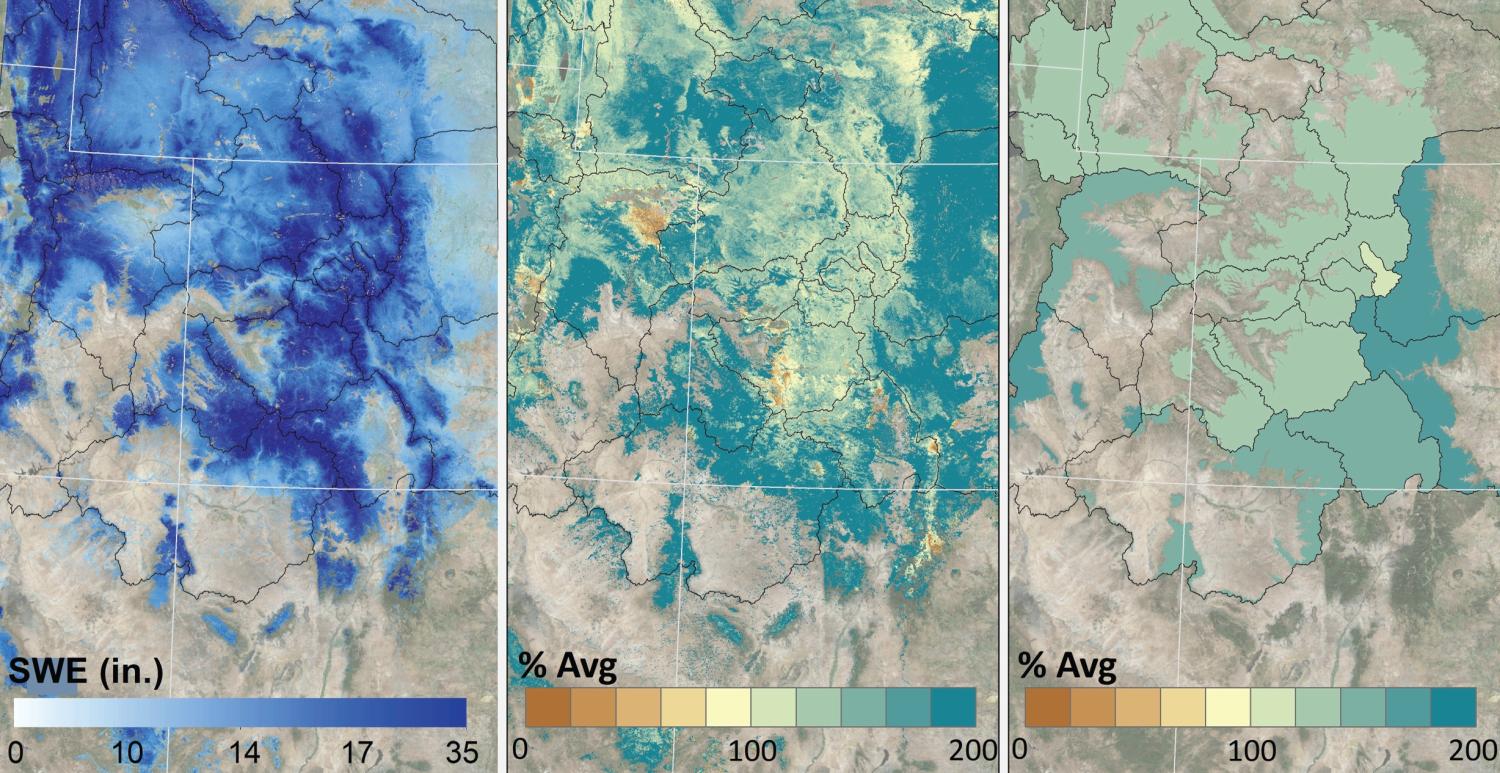
This research product provides near-real-time estimates of snow-water equivalent (SWE) for areas in Colorado, Utah, and Wyoming at a spatial resolution of 500 m.
We create reports for specific regions approximately every two weeks from mid-winter through the end of the melt season. The reports are released within a week of satellite image data acquisition and are distributed to water managers and forecasters. For more information on reporting or to discuss reporting for your area please contact Leanne.Lestak@colorado.edu.
See also:
Sierra Nevada SWE reports 2019-present (California)
Western US SWE reports 2025- (Whole region)
2023
All Files for 2023 (2023 zip)
Includes: Report, Table 1&2, CBRFC Table, JPG maps
Feb 01, Feb 15, Mar 01, Mar 15, Apr 01, Apr 15, May 01, May 15, & Jun 01
2022
All Files for 2022 (2022 zip)
Includes: Report, Table 1&2, CBRFC Table, JPG maps
Mar 01, Mar 15, Apr 01, Apr 08, Apr 18, Apr 25, May 01, May 08, May 15, May 25, & Jun 02