
Tomatillo fruits and calyces don’t grow together
Fruit and calyx development in the sharpleaf groundcherry, by Erica Au
Project Background
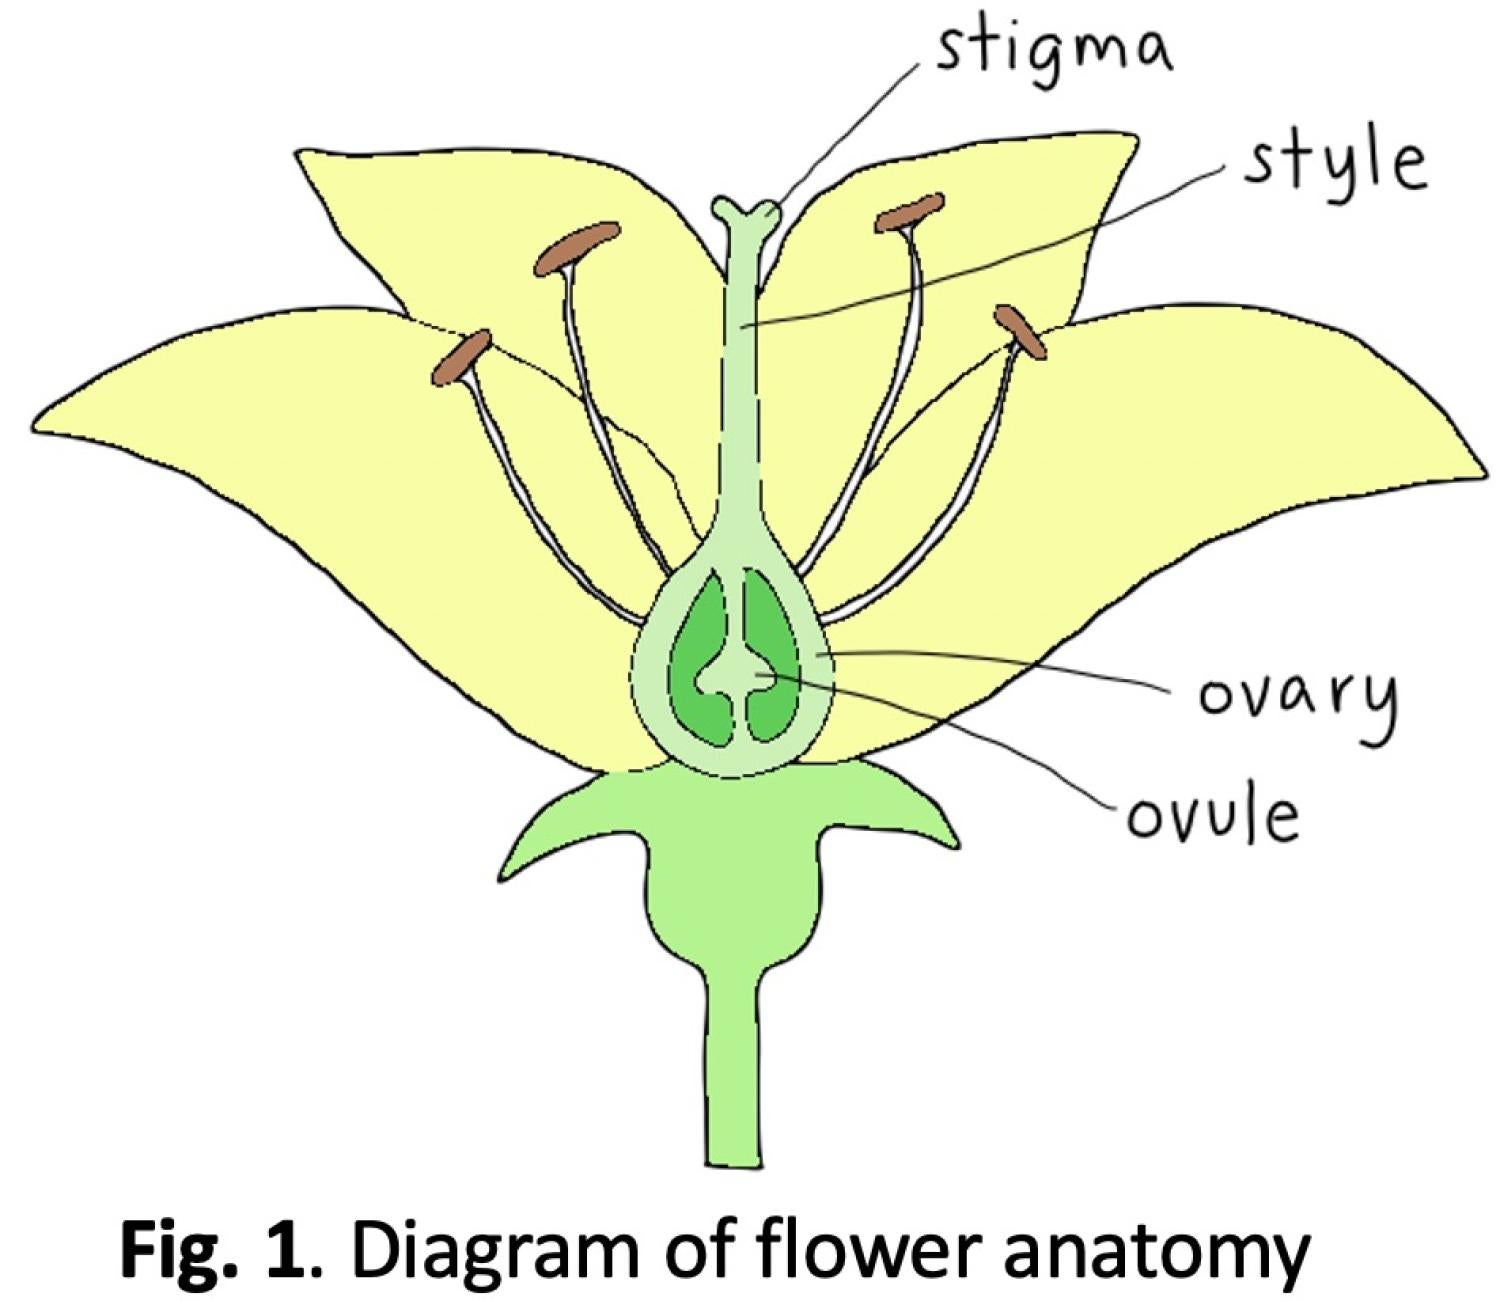
Pollination happens when either an organism or abiotic factor aids in the transport of pollen to the stigma of a plant. In order to reach the ovary to fertilize the ovules (eggs), the pollen grows down the style (Fig. 1). This is where the factor of compatibility of the pollen to the plant comes into play. Only compatible pollen can reach the ovules and fertilize them to grow into seeds. A self-compatible plant can create seeds (and fruits) using its own pollen while self-incompatible plants cannot. Self-incompatibility ensures genetic diversity because these plants only take in foreign pollen, which is advantageous for obtaining beneficial traits that could increase the fitness of offspring. Conversely, self-compatibility is useful for farming because SC plants will always have its own pollen to use to reproduce and make fruits to harvest.
This fall I studied the sharpleaf-groundcherry, Physalis acutifolia, a plant that can either be self-compatible (SC) or self-incompatible (SI). It is a member of the tomatillo genus and yields small round fruits that are enclosed by a papery, lantern-like calyx that grows after fertilization, as the fruits mature (Fig. 2). Examining the compatibility of pollen in P. acutifolia can give researchers, agriculturists, and horticulturists more insight on breeding and the evolution of P. acutifolia in dynamic climates within the Southwest region of the United States, as well as in agricultural settings. Additionally, it may also create predictions on how other species within genus Physalis may perform when being self-compatible or self-incompatible . Examining the fruit size yield of the edible members of the genus can be key to cultivating them efficiently. For example, by knowing how compatible the plant is with itself can allow agriculturists to devise an appropriate procedure on farming the largest fruit and knowing if either SC or SI individuals are best for farming.
Project Overview
My interest in botany and plant evolution led me to join the Smith lab with Chelsea Pretz as my mentor. I started assisting Chelsea on her project on the evolution of self-compatibility of P. acutifolia in 2021 under the interest of plant morphology and controlled greenhouse crosses. When I joined the Smith lab not only did it cater to my interests in plant biology, but also provide the ideal environment to obtain skills that are useful for a future working with plants. Additionally, working in a professional lab setting can help me become familiar with a lab work environment.
Throughout the semester, I was able to work in a greenhouse and lab setting. In the greenhouse, I learned to properly collect and organize data on fruits, flowers, and calyx. While in the laboratory, I got to observe and assist in the process of extracting and weighing styles. Later in the semester, I learned to extract seeds and take images of individual calyx and fruits. I then used the ImageJ program on these images to measure calyx length and width, as well as calculate fruit area size.
My independent project within the lab will act as preliminary data in looking into differences between calyx area and fruit area size among plants grown from different crossing treatments (SC self, SC/SI, SI self, SI/SC, note: SI self are seeds from SI individuals that had become SC within their lifetime). I was interested in seeing if there was a relationship between cross type and the size of calyx and fruit it yields. Using the data I collected from ImageJ, I selected 3 individuals of each treatment and took 3 measurements from each of these individuals to graph. To get a rough estimate of calyx size, I used the product of calyx length and width. I used a standard box plot and violin plot in Rstudio to visualize my data. The variations of boxplots I used were appropriate visualizations for what I wanted to examine because they display the quantiles and outliers of areas. This can allow me to see a general range of the area measurements in each treatment and see how much these ranges differ between the treatments.
The average calyx areas among the different treatments are relatively consistent, ranging from 3-4.5 cm2 with some outliers in the SC self and SI/SC treatments. The p-value of 0.406 indicates that there is little or no significant difference between the treatment mean areas.
Across the treatments, there is high variation of the concentration of measurements and the fruit area means. Fruit area of the SI self treatment has the highest values around 1.5-2 cm2, while SC self, SC/SI and SI/SC had varying spreads around 1-1.75 cm2. The p-value of 0.00752 indicates that at least one of the treatments means significantly varies from the other treatment groups, which in this case, is the SI treatment.
Interpretation and Final Thoughts
From the results of graphing calyx and fruit sizes of the different treatments, there seems to be little difference between calyx sizes but some significance between fruit sizes. This shows how even though the calyx sizes are relatively consistent, the fruit inside could vary significantly, which is interesting since calyx and fruit grow simultaneously. The SI self treatment has the highest range of fruit area size, which could suggest that there is better performance of creating larger fruit by transitioning from SI to SC. This may also suggest that there could be inbreeding depression with the SC treatments because their fruit area ranges are lower than the SI treatment. Inbreeding depression happens when individuals of close genetic relation mate, and as a result, their offspring have reduced fitness. Smaller fruits decrease fitness because less seeds are produced compared to a large fruit. Although, because this is preliminary data, conclusions may change with larger sample size.
My independent research experience allowed me to contribute to data collection and get to do some data management and analysis on my own. My project challenged me to use skills and knowledge that I’ve learned in previous courses and apply them effectively to my data and analysis. For example, using Rstudio to plot my data and determine what kind of graphs would provide the best visualization of what I want to examine.
When collecting fruits and extracting seeds, I’ve noticed an interesting disparity between the SI and SC plants and the diversity of seed size and color. Some fruits yielded thin and pale seeds, while some were more round and of light or darker brown color. The thin, paler seeds look unviable and underdeveloped compared to the seeds with more pigment and rounder shape. This would be an interesting future project to consider studying because these contrasting seed types may be connected to their viability and can provide further insight on SC and SI individuals.