
Kurt Lindberg - Project Profile
2021 AGeS awardee
Lab: Ramped Pyrolysis-Oxidation 14C Preparation Laboratory
Lab Mentors: Brad Rosenheim
What scientific question(s) does your research address and what motivates this work?
My AGeS-funded research addresses the question, “how did Early Holocene warming and other climate trends over the past twelve thousand years affect rates of permafrost thaw in northeastern Baffin Island”? This work is motivated by rapid warming in the Arctic over the past several decades due to anthropogenic climate change which has been altering regional carbon cycling dynamics. For example, permafrost has been thawing at an increasing rate, leaching more ancient organic carbon into rivers and lakes while destabilizing the terrestrial landscape and releasing additional greenhouse gasses into the atmosphere. While changes to the Arctic carbon cycle are well documented in the instrumental record, the same cannot be said for past episodes of Arctic warming. During the Early Holocene (11.7 to 8 ka), temperatures in the Canadian Arctic were up to 5°C warmer than modern day for millennia, with the resulting environment serving as a potential analogue for future warming. My AGeS-Grad project uses geochronology techniques to produce quantitative estimates of permafrost organic carbon input over time in a northeastern Baffin Island lake to provide us context for how the Arctic carbon cycle may continue to change as the planet gets warmer.
What chronometric tool did you employ and why?
To answer my research question, I employed Ramped Pyrolysis Oxidation (RPO) paired with radiocarbon (14C) dating to estimate the proportions of organic carbon sources in downcore sediments from Lake CF8, Baffin Island, Nunavut, Canada (Image 1). I used 14C dating because different organic carbon sources to Canadian Arctic lakes, mainly aquatic primary productivity and permafrost/soil, have different 14C ages when mixed together in the lake’s sedimentary record. Aquatic productivity in the lake is at equilibrium with 14C in the atmosphere, so 14C does not decay until the aquatic biomass dies and gets subsequently buried. Meanwhile, permafrost/soil can remain on land for thousands of years before getting transported to the lake, causing its 14C to be older than aquatic biomass when both sources are deposited at the same time. RPO combusts sediment over a thermal gradient, oxidizing organic carbon into CO2, allowing us to date multiple thermal fractions of the same sediment which may contain different proportions of organic carbon sources if they are thermochemically distinct (Image 2). The 14C age difference between RPO-produced CO2 and aquatic plant macrofossils, equal to the aquatic endmember age, represents the relative amount of permafrost/soil in a sediment interval.
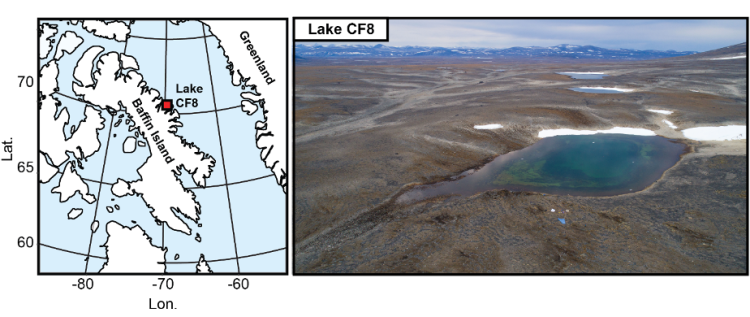
Figure 1: (left) Map of Lake CF8 (70.56 °N, 68.95 °W; red square) in the Clyde Foreland of northeastern Baffin Island, Nunavut, Canada. (right) Aerial photo of Lake CF8 taken during the 2017 summer field season by Zach Montes.
What were some of the key takeaways of your research?
- All CO2 fractions in every temperature range produced from ramped pyrolysis of Lake CF8 bulk sediments have older 14C ages than their corresponding aquatic plant macrofossils. These fractions, therefore, all represent a mix of contemporaneous and relict organic carbon sources which were not effectively separated from the bulk sediment via this RPO technique.
- The largest CO2 age offsets from the macrofossils, interpreted as greater inputs of relict permafrost/soil occur at 12.5 ka following local deglaciation, at 9 ka during peak warmth of the Early Holocene, and at 6 ka while temperatures were cooling from their Holocene maximum as summer insolation decreased.
- While large CO2 age offset and high permafrost input were a feature of peak warmth during the Early Holocene, the presence of other, high-offset intervals during cooler periods suggests that local carbon cycling of relict organic material is not entirely synchronous with changes in local climate over the past twelve thousand years.
What new experiences, opportunities, and collaborations did you gain as an AGeS-Grad awardee?
As an AGeS-Grad awardee, I gained a valuable research collaboration with my geochronology lab host, Dr. Brad Rosenheim, at the University of South Florida St. Petersburg. Not only were he and his lab manager, Devon Firesinger, excellent hosts when I visited in June 2021 (Image 3), but we have maintained contact since I began my writing my AGeS grant proposal at the start of that year. Having consistent communication has allowed us to regularly exchange ideas between Dr. Rosenheim’s expertise in globally diverse carbon cycling environments and my knowledge of my study site in the Canadian Arctic, a region where his Ramped Pyrolysis Oxidation method had not been applied previously. During my lab visit, I gained experience in prepping samples for radiocarbon dating, a process which I would not have been involved in otherwise during my PhD program. By presenting my AGeS-Grad research at conferences, including the 2022 Northeast GSA sectional meeting and GSA Connects 2022 national meeting, I have had the opportunity to talk with other early career and established academics who are also actively involved in studying geochronology techniques applied to the Arctic during the Quaternary period.
What is one piece of advice you have for future AGeS-Grad award applicants or awardees?
My advice for future AGeS-Grad applicants is to not only develop a strong, testable hypothesis for your proposed project, but to also consider potential interpretations for your data if they do not support your hypothesis. Doing so will show that you have thought about your research question and chronology tool more holistically in the context of your geologic system.
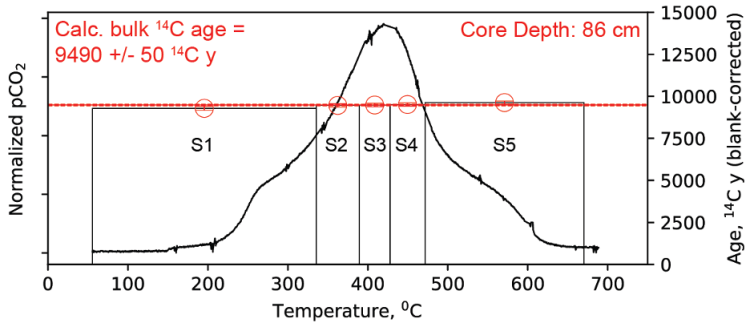
Figure 2: Sample thermogram/age vs. temperature plot produced by RPO and 14C dating from a Lake CF8 sediment sample taken from 86 cm deep in the core. The left y-axis corresponds to the black curve showing how much CO2 was released from a bulk sediment sample at each temperature as the pyrolysis furnace heated up. The right y-axis corresponds to the rectangles, labeled S1-S5, showing the 14C age of each CO2 split captured at the temperature range notated by the vertical lines of each rectangle.

Figure 3: (a-e) Photos of the RPO process, in sequential order, taken during my June 2021 visit to Dr. Brad Rosenheim’s lab at the University of South Florida St. Petersburg. (a) Furnace that combusts sediments/samples up to 1000 °C, releasing oxidized organic carbon as CO2. (b) Coiled tubes used to condense and isolate temperature fractions of CO2 using a mixture of liquid nitrogen and isopropyl alcohol. (c) Gas line used to remove water vapor from CO2 samples and move them into a collection ampoule for radiocarbon dating at another facility. (d) Me learning how to flame seal an ampoule at the start of my visit. (e) Also me flame sealing an ampoule of a real CO2 sample for my AGeS-Grad project surrounded by the entire RPO apparatus.