
Research Topics
Current-Driven Buneman Instabilities
Martin V. Goldman and David L. Newman
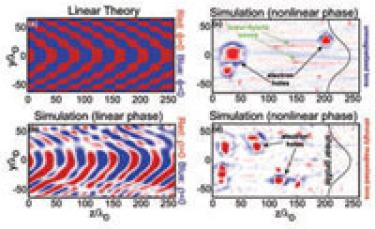
Figure 1: Spatial variation of the charge density ρ from two periodic 2-D Vlasov simulations.
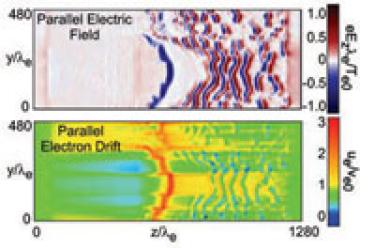
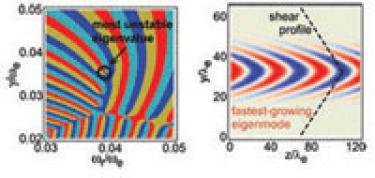
Figure 2: The eigenvalue spectrum in complex frequency space (left) and the fastestgrowing eigenstate (right) for a triangular shear profile.
An important instability in both space and laboratory plasmas is the current-carrying Buneman instability, which results from a relative drift between electrons and ions. For example, recent studies by J. Drake (Univ. Maryland) and his colleagues have shown Buneman instabilities to play an important role in magnetic reconnection. We have employed theoretical analysis and kinetic simulations to study the role of velocity shear (i.e., gradients perpendicular to B in the drift velocity parallel to B) on both the linear and nonlinear evolution of a Buneman-unstable plasma. Figure 1 shows the spatial variation of the charge density ρ from two periodic 2-D Vlasov simulations. In these simulations, the electrons are strongly magnetized and drift at a velocity that varies sinusoidally in y (black curve in frames c and d), while the ions are unsheared, non-drifting, and alternatively unmagnetized (c) or strongly magnetized (b and d). The linear state (b) is similar for both ion magnetizations and is in good agreement with the theoretically determined most unstable eigenstate for the potential φ based on a Mathieu function analysis (a). The nonlinear states are dominated by the coherent regions of positive charge density associated with electron phase-space holes. These holes appear to favor regions (in y) where the velocity gradient is locally a maximum when the ions are strongly magnetized, and regions where the electron drift is locally a maximum for unmagnetized ions. Lower-hybrid waves are also seen in the unmagnetized simulation. A numerical eigenvalue-eigenstate analysis capable of treating a more general class of distribution functions (including non-sinusoidal shear profiles) has been developed as well. Figure 2 shows the eigenvalue spectrum in complex frequency space (left) and the fastestgrowing eigenstate (right) for a triangular shear profile. Here, the eigenvalues are located where the four differently colored regions—corresponding to the four quadrants of the complex dielectric plane—meet at a point. The circled point is the eigenvalue with the globally largest growth rate Y.
Electron Drift-Interface Instabilities
Martin V. Goldman and David L. Newman
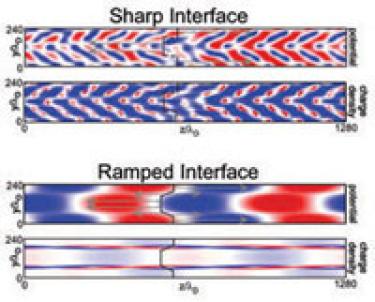
Figure 3: Electrostatic potential and charge density from 2-D.
Periodic Vlasov simulations with electron flow reversal that is either sharp (top) or gradual (bottom). Another regime where shear may play an important role is in regions of spatially local flow or current reversal. Such reversals may occur, for example,in association with Alfvén waves in Earth’s auroral zone. To study the types of instabilities associated with an electron flow reversal interface, we have performed 2-D Vlasov simulations with strongly magnetized electrons and static ions. Figure 3 shows the potential and charge density distribution during the linear phase of two runs differing only in the details of the velocity shear profile. In the top example, the interface is sharp, with no transition between oppositely flowing regions. In the bottom example, the interface is gradual, with a thin layer in which the flow velocity ramps between the two limiting values. The fastest growing modes are quite different in the two regimes: The sharp transition is characterized by a global herringbone structure in the potential and charge density, whereas the gradual transition is characterized by the charge-density perturbation largely localized to the interface layer.
Kinetic Simulation of Double Layers and Associated Nonlinear Field Structures in Earth's Auroral Zone
Martin V. Goldman, David L. Newman and Naresh Sen
We have established an ongoing collaboration with Prof. Robert Ergun and his associates at the Laboratory for Atmospheric and Space Physics (LASP) on the evolution and dynamics of nonlinear structures in Earth's auroral current region—especially double layers and electron phasespace holes. Our investigations employ kinetic Vlasov simulations in one and two-dimensions, where novel reduced algorithms are being employed in 2-D to enhance the efficiency of the simulation codes.
Stabilization of Double Layers by Hot Electron "Halo" Distributions
Martin V. Goldman, David L. Newman and Laila Andersson
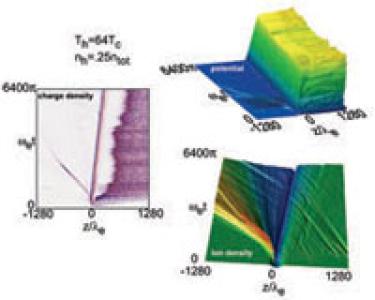
Figure 4: Time-histories of charge density, ion density, and electrostatic potential, from a 1-D Vlasov simulation in which the electron distribution contains a relative dense halo component. Note the relative stability of all diagnostics.
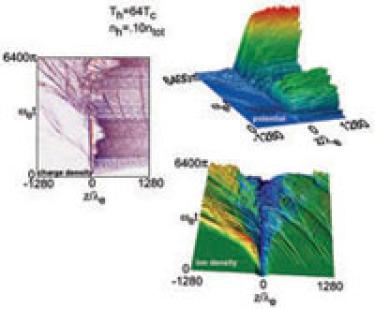
Figure 5: Same as Fig.4, but with a reduced halo density. Note how all diagnostics exhibit a great deal of temporal variability, indicative of turbulent structure.
In collaboration with LASP Researcher Laila Andersson, we have performed a new series of 1-D open-boundary current-driven simulations varying only in the assumed distribution of hot halo electrons, which now clearly show how such halos can stabilize double layers against disruption by Buneman instabilities and other mechanisms. Figures 4 and 5 illustrate the effect of reducing the density of halo electrons on the time-dependence of three simulation diagnostics: charge density, ion density, and electrostatic potential. For the stronger halo (Fig. 4), the strong bipolar perturbation in charge density—from which the term "double layer" originates—maintains its form over the duration of the run as it moves slowly to the right. The deep density depression co-located with the strong double layer and the associated jump in potential are likewise of approximately fixed magnitude, although a broader and weaker density depression does expand outward from the location of the double layer itself. The large standoff distance or "gap" between the double layer and the electron holes to the right (appearing as near-horizontal streaks in the charge density) is another characteristic of the laminar state. By contrast, all three diagnostics show much greater temporal variability when the density of halo electrons is reduced, as in Fig. 5, which is indicative of a turbulent state. Of particular interest are the leftward-moving ion density perturbations approaching the double layer from the right. These perturbations appear to be driven, in part, by the electron holes that rapidly propagate away from the double layer toward the right boundary. In turn, these perturbations may play a role in the disruption of the double layer itself. Note also the disappearance of the standoff gap except during a brief laminar phase. The influence of electron halos on the structure of the electrostatic potential and particle distributions is consistent with recent FAST satellite observations.
2-D Double-Layer Evolution with Unmagnetized Ions and Strongly Magnetized Electrons
Martin V. Goldman and David L. Newman
Figure 6: Late-time diagnostics from a 2-D reduced Vlasov simulation with strongly magnetized electron and unmagnetized ions showing the parallel electric field (top) and mean parallel electron drift (bottom). The double layer is the curved structure in the middle of the simulation domain.
A new algorithm for modeling the dynamics of unmagnetized ions perpendicular to the direction of the driving current in 2-D reduced Vlasov simulations has been developed, using a method known as dissipative moment closure. Figure 6 shows the parallel electric field and mean parallel electron drift from late in the simulation after a strong double layer has developed. Although the simulations initial conditions were uniform in the y direction, a curved double layer developed self-consistently. Note also how sharp electron flow discontinuities develop to the right of the double layer, which ties in to our previously mentioned studies of interface instabilities.
Mid-cavity Double Layers in Earth's Auroral Upward Current Region
Martin V. Goldman and David L. Newman
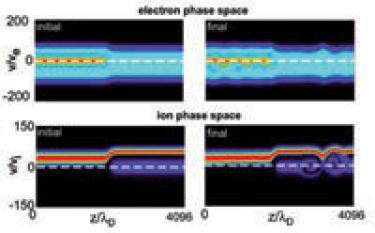
Figure 7: Electron and ion distribution functions from the beginning and end of a 1-D Vlasov simulation of a mid-cavity double layer in the the upward current region of Earth's auroral zone.
Although most of our simulations have been applied to the downward current region of Earth's auroral zone, we have begun to look at the upward current region as well. Here, a 1-D simulation was initialized with an analytical solution derived by Robert Ergun for mid- cavity double layers (so named because they are based on observations from the interior of the auroral cavity, which separates the ionosphere and magnetosphere). Figure 7 shows the initial and evolved electron and ion distribution functions from this simulation. The dominant features of the evolved distributions are the ion phase-space vortices to the right of the double layer, although instabilities have also modified the electron distribution to the left of the double layer.