
Randomness in Number Theory, Spring 2019
Supervisors: Dr. Paul Beale (physics) and Dr. Katherine Stange (mathematics)
Students:
- Guofeng Deng
- Ezzeddine El Sai
- Aaron Li
Real randomness is hard to come by, but there are mathematical ways to generate pseudo-randomness using number theory. Such pseudo-random number generators are used in your computer, for example. How random is their output? There are various tests for randomness, such as correlations between consecutive bits. More interesting tests use the randomness to model physical phenomena and check if there is agreement with real physical systems. So, how random are number theoretical sequences like prime numbers? It was only surprisingly recently that mathematicians spent some time thinking about correlations in the sequence of primes modulo 10.
In this project, we implemented statistical tests of randomness according to Chapter 5 of the Handbook of Applied Cryptography. The prime numbers modulo n appear strongly non-random in the calculable range, in line with known literature on the topic. We expanded our investigations to several topics:
Statistical tests for randomness
To quantify randomness in sequences, we implemented cryptographic tests to uncover any obvious patterns and correlations. It is important to note that that while these tests are able to detect non randomness, they cannot conclusively state that a sequence is random. The most notable test we used is Maurer’s universal test, which efficiently approximates how compressible a sequence is. Patterns in a non random sequence could be exploited by a compression algorithm to make shrink them which is why compressibility makes for a good measure of randomness. One of the most surprising results, is that the Fibonacci sequence in binary form (at least as much as we were able to generate) is able to pass very sensitive tests like Maurer’s universal test.
Gaussian primes and integers in the complex plane
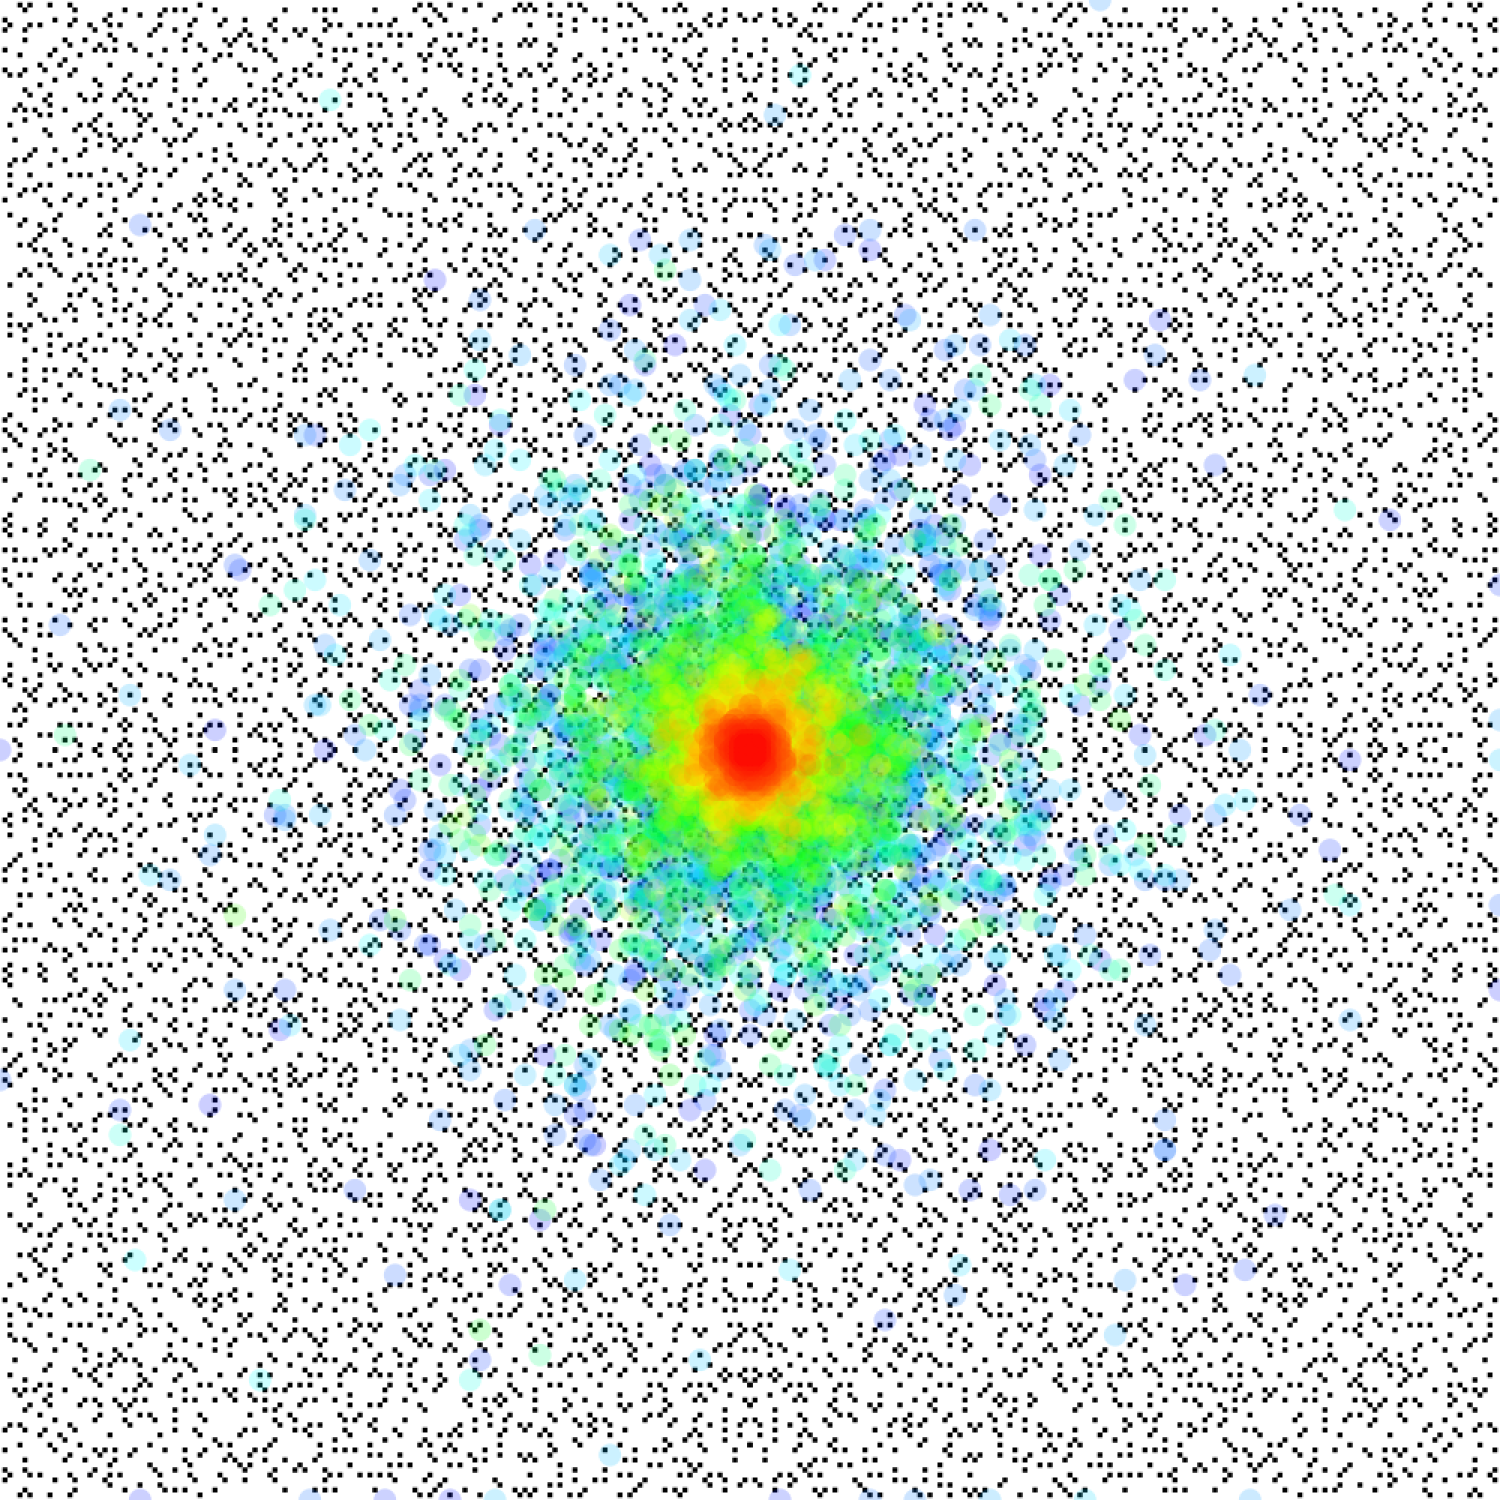
Generalizing real integer sequences to the complex plane can sometimes reveal interesting patterns and symmetries. The gaussian primes for example (which generalize prime numbers) exhibit planar symmetries and give rise to new structures. The structure of prime gaps for example isn’t as well understood, the gaussian moat problem asks: is it possible to walk on the gaussian primes to infinity such that all leaps are within a bounded size?
To explore this problem visually, we implemented a random walk algorithm to see how far one can go given different leap bounds. The color represents the magnitude of the allowed leap, and each spot is the terminal point for each walker.
Nearest Prime Neighbours
Consider the question of prime distribution around the terms of an integer sequence, such as consecutive square numbers. Specifically, we generate a sequence of square numbers, and then check for the nearest prime around each square number. If the nearest prime is above (larger than) the square number, then record a 1 in the bit sequence; if the nearest prime is below (smaller than) the square number, then record a 0 in the bit sequence.

We expected the probability of these two cases should be equal as the tested sequence goes infinity. However, we found that the proportion of occurrence of case 1 converges to 49% while the proportion of occurrence of case 0 converges to 46%. (The remaining 5% is the case when the nearest primes of the square number have the same distance to the square number.) Although it was interesting to see the proportions do converge to some specific values as the tested sequence get larger, we were trying to figure out a method to make the proportion of these two case equal or the reason why the occurrence of these two cases are not equal. Initially we thought it was caused by the “formula for the difference of two squares”. Specifically, when testing the nearest prime of n2, the numbers n2-1, n2-4 can be factorized to (n-1)(n+1), (n-2)(n+2) etc, so they will never be primes. Thus, we thought it may be the reason for the bias of the previous result. Then we tried different ways to correct the bias, including ignoring the numbers with the distance to the square number is also a square number (both or either below or above). Also, we tried to consider the even/odd cases, since the sum (or subtraction) of two even/odd numbers cannot be prime. With several combination of these methods, the result got better (the proportions get closer to be equal), but still not as expected to be equal.
We also considered how other sequences, such as affine transformations of the primes (e.g. twice the primes, plus a translation), lie in prime gaps (this appeared random). There is code on our github repository for testing this type of statistic on other sequences.
Ulam Spirals
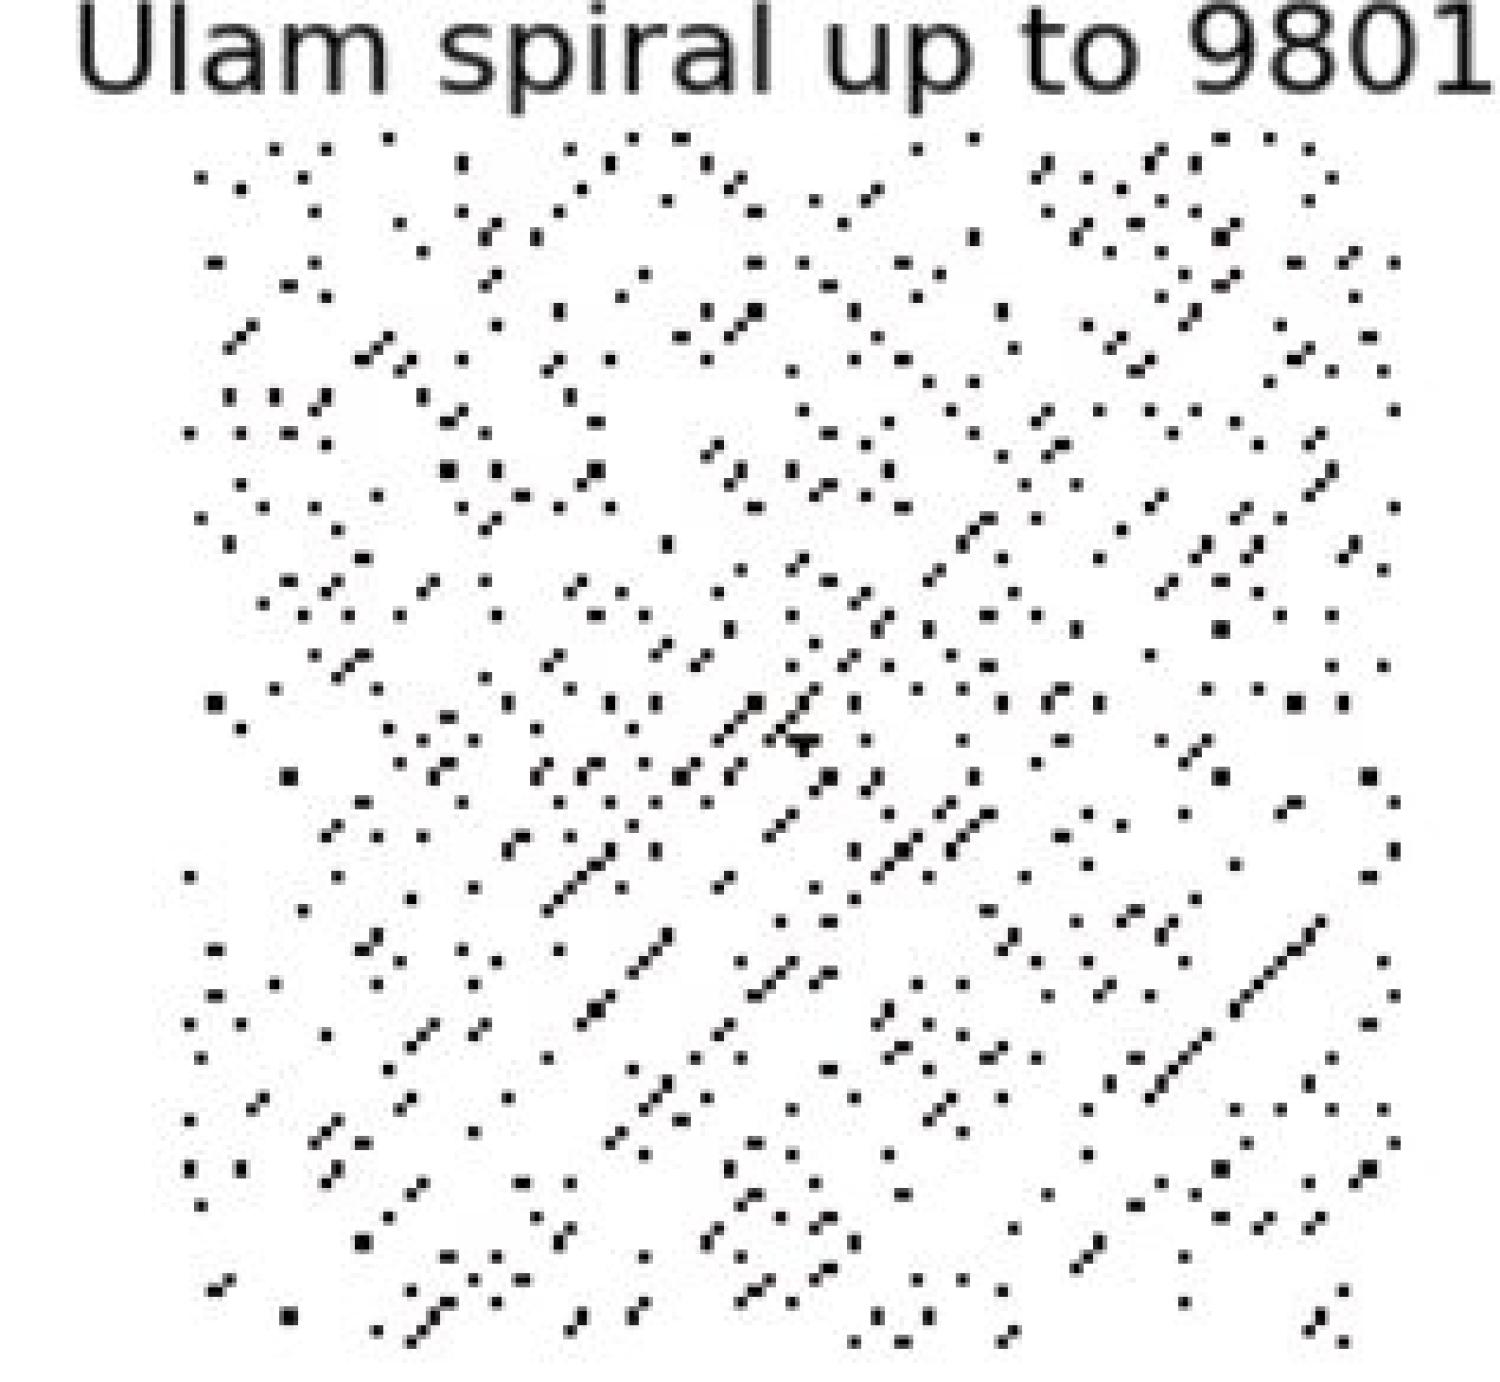
The Ulam Spiral is a method to visualize the primes by taking the whole numbers and creating a spiraling square of the numbers as shown in the figure.

Once the spiral is created, the primes which were 3 mod 4 were chosen and colored black while the all other numbers were colored white. The result looked like this:
After creating this image, a question our group had was the given a number on this graph, how many of the number's neighbors are prime. In a square region of width r surrounding each prime, we counted the number of primes in the spiral. The results can be shown in a histogram. Here are some results for various values of r.
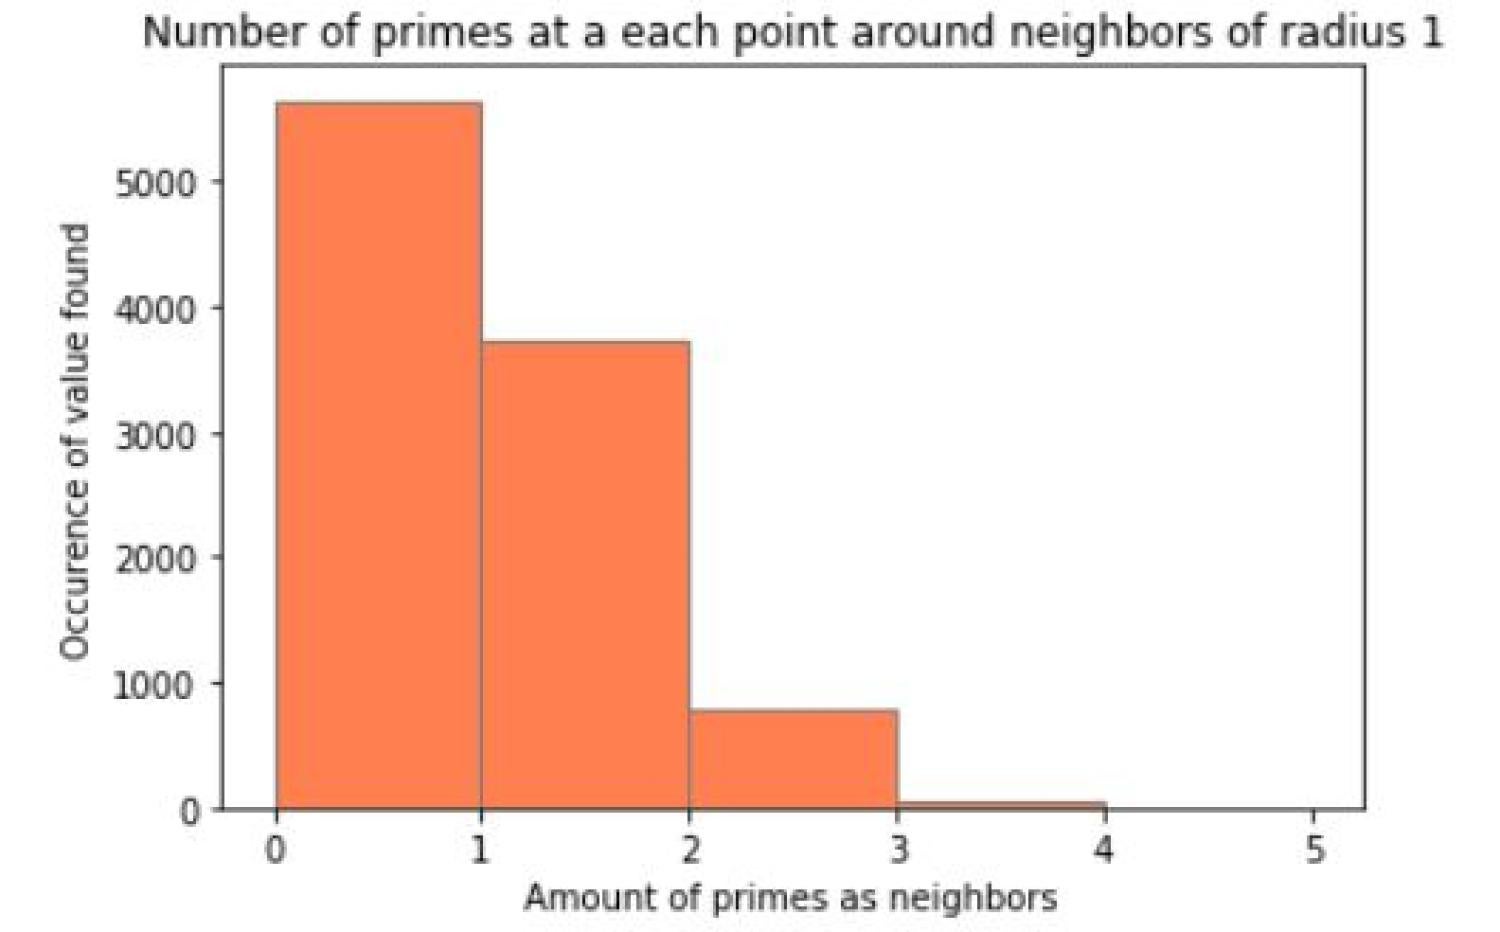
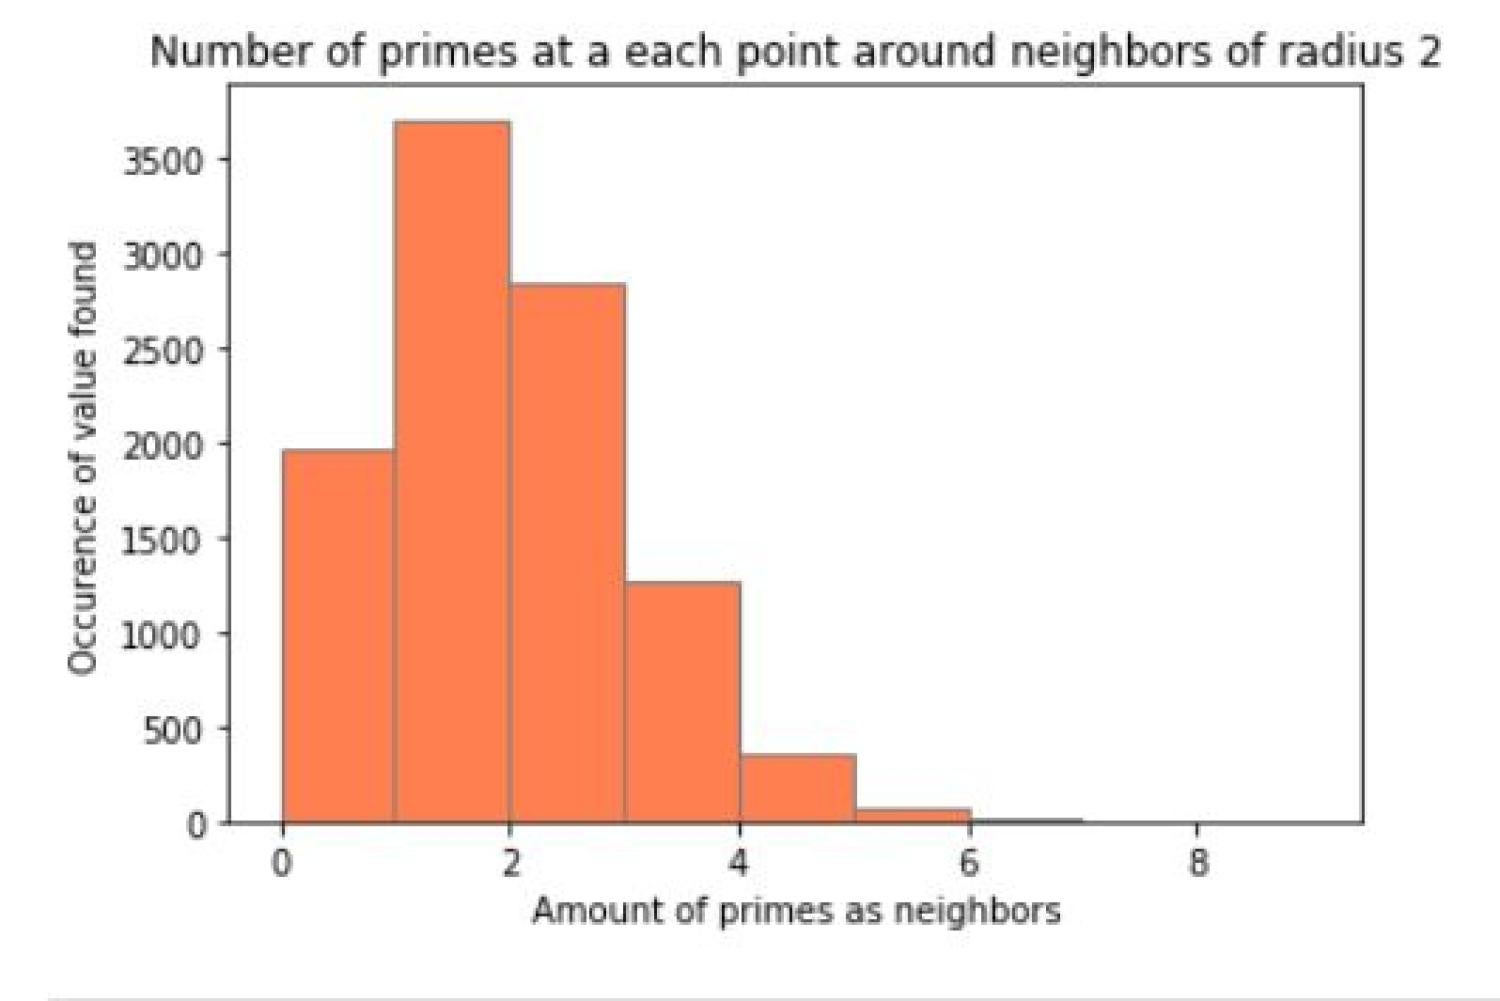
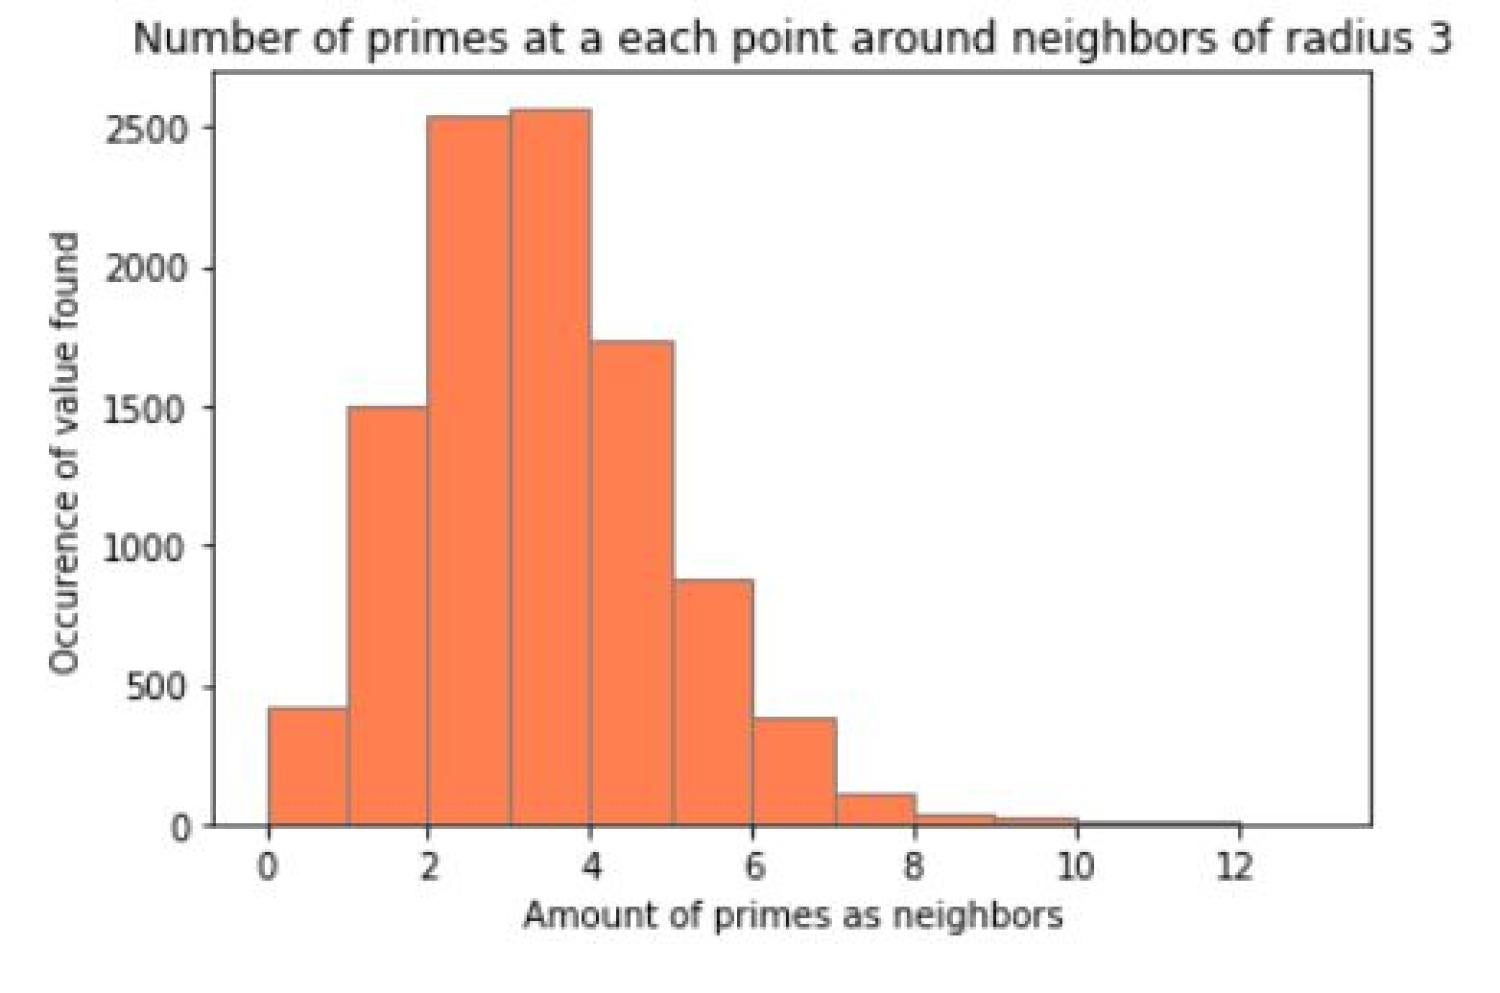
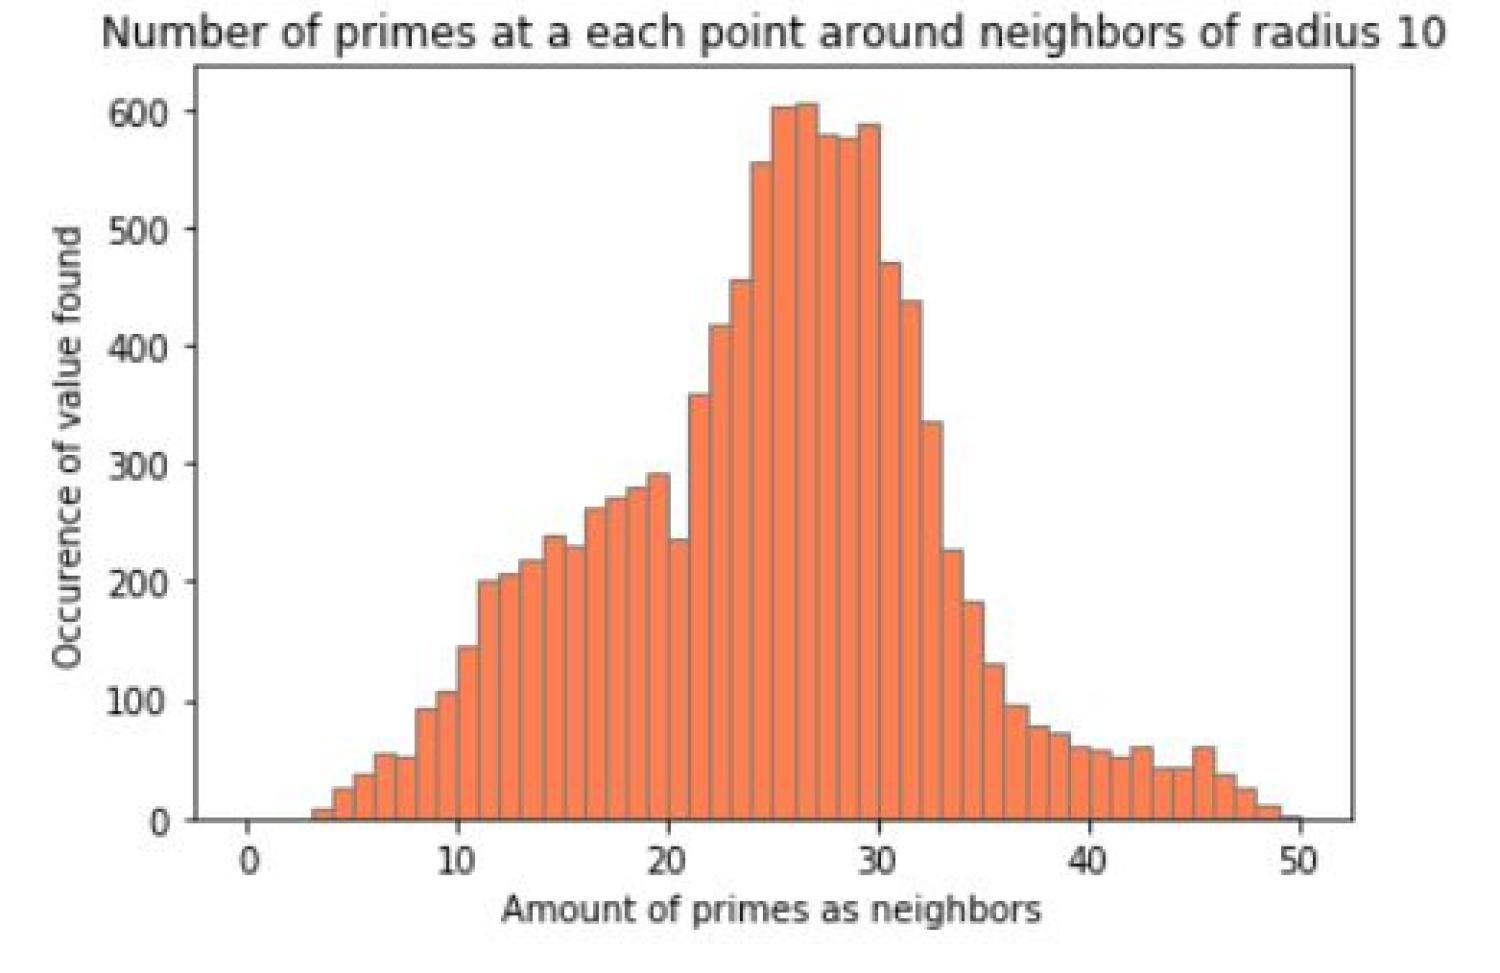
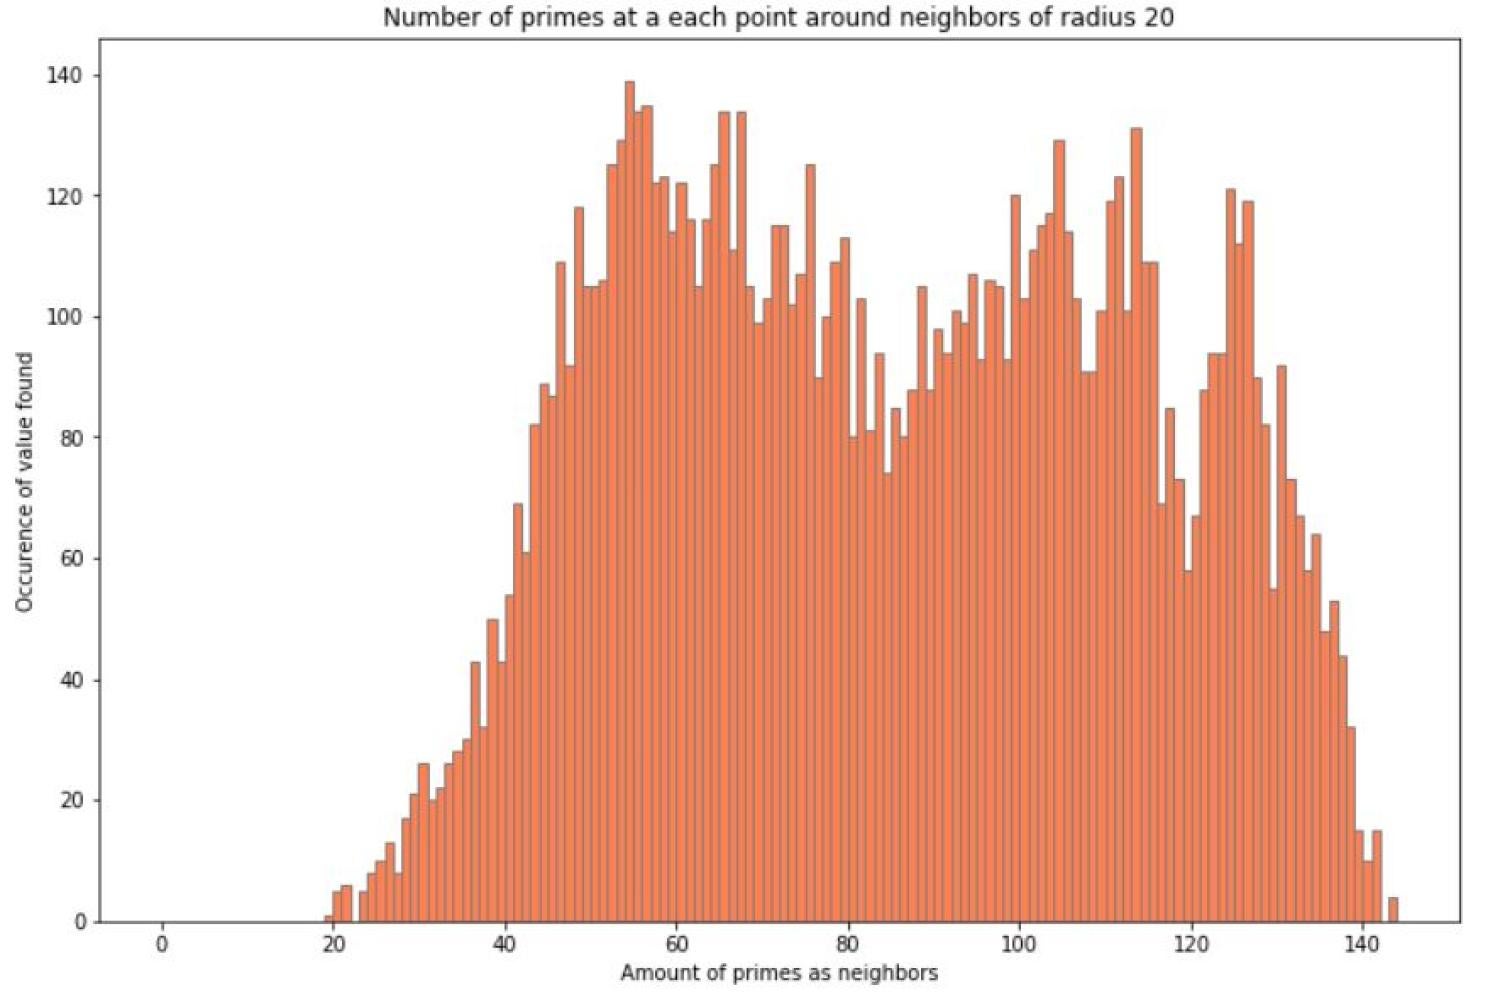
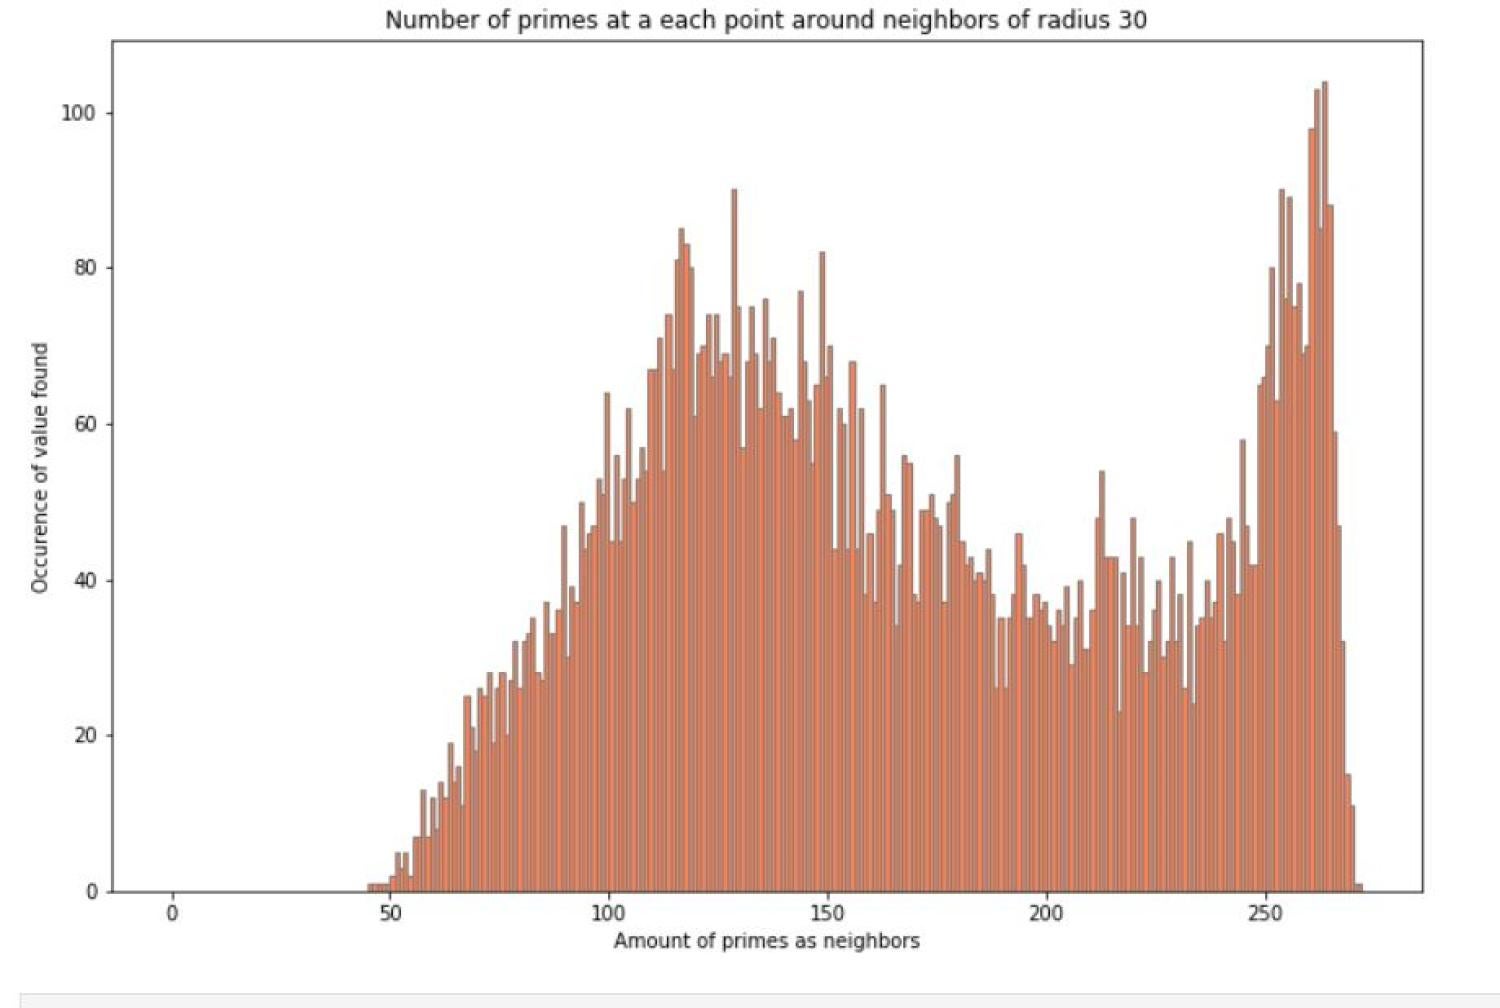
With radius of 1 as the area of interest for each point, the vast majority of numbers and its neighbors were not prime and we see a right-skewed image. However, as the radius increased the graph also began to change. The number of primes and neighbors that are also prime begin to create a normal distribution! This peaked our interest so we decided to increase the radius even further. As the radius began to increase, the histogram went from a normal distribution to an almost bimodal distribution when the radius is 30. This change in appearance could be caused by the constraint of the graph since only up to 9801 numbers were plotted but could also be because the density of primes decreases as the numbers increase.
Github Code
Code for this project is available on github. There are:
- statistical tests from Handbook of Applied Cryptography
- code for testing the proximity of a sequence to primes (i.e. nearest prime neighbour to terms of sequence)
Back to the Experimental Mathematics Lab