
Wind power you can bank on
Incorporating wind energy into today’s electrical grid raises a host of questions about wind forecasting, wind-turbine siting, wind-turbine design in hurricane zones; CU Boulder lab is investigating these and other questions
With costs falling and installations soaring, wind energy has become a power to be reckoned with. But its rise brings a host of new challenges.
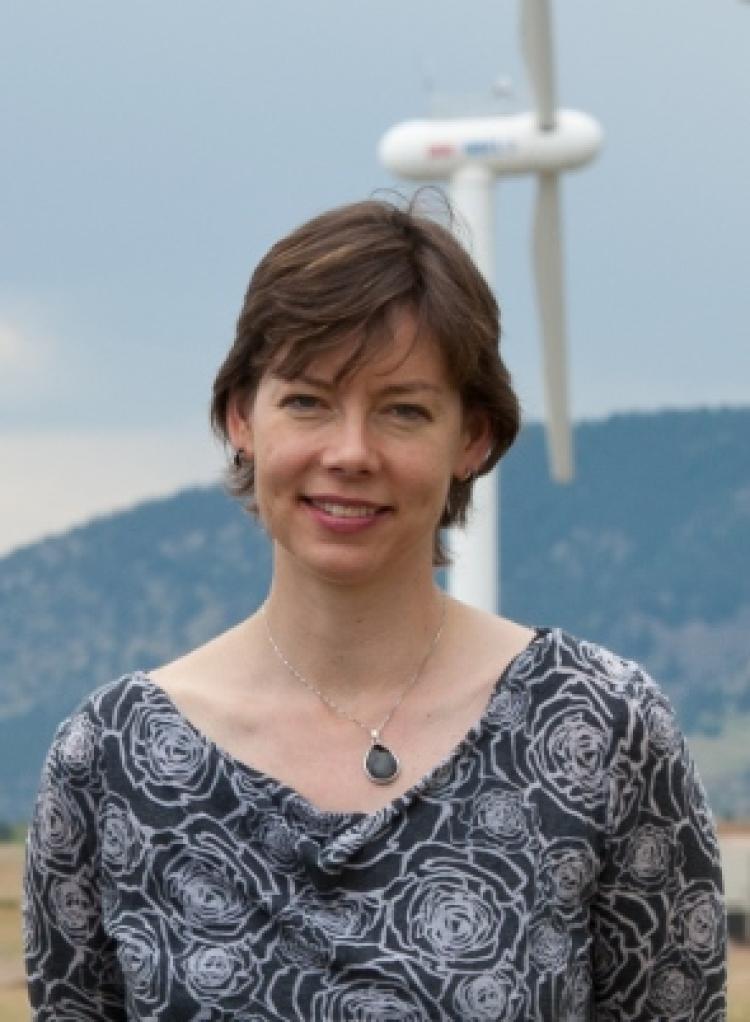
Julie Lundquist
Wind-energy companies need more-accurate wind-resource assessments to persuade banks to loan funds to build new facilities; wind-farm firms should understand how best to situate individual wind turbines in a farm to maximize production; utility operators should have a better sense of when, where and how fast the wind will blow up to a day ahead of time so that grid operators can plan to cut fossil-powered plant generation. And offshore wind farms, which the United States is only beginning to install, need to be able to withstand hurricane winds or have risk management mechanisms to ensure their financial viability.
Researchers in the Department of Atmospheric and Oceanic Sciences (ATOC) at the University of Colorado Boulder are among a growing body of scientists expanding the frontiers of human knowledge in these and related areas.
They presented an array of their recent findings during the American Meteorological Society Annual Meeting in Seattle this year.
Julie Lundquist is an associate professor of atmospheric and oceanic sciences at CU Boulder who holds a joint appointment at the National Renewable Energy Laboratory in Golden. She and her fellow researchers are striving to help better integrate wind power into the U.S. electrical grid.
Wind energy now composes about 5 percent of U.S. electrical generation, with 76 gigawatts installed by 2016, up from 34 gigawatts in 2009.
Power production you can bank on
Finding: Long-term wind data analyzed in a certain way yield better results
Financial ratings companies such as Moody’s and Fitch Ratings have noted the discrepancy between initially projected and actually produced wind power. Because of this over-estimation, banks have offered less-favorable financing than wind-farm prospectors seek.
ATOC graduate student Nicola Bodini and colleagues Dino Zardi at the University of Trento and Mark Handschy of the CU Boulder Cooperative Institute for Research in Environmental Sciences (CIRES) worked with Lundquist to probe this discrepancy: “It seemed like there would be an atmospheric connection, so we started investigating,” Lundquist said.
Their analysis of a 62-year data set of wind speeds measured at 60 sites across Canada identified the source of wind-power over-estimation.
The wind-power industry banks on a site’s estimated “P50” value, which defines the middle of the expected range of annual power production—production should exceed P50 in half the years of a wind plant’s life. Analogously, the “P90” value is a production floor that the plant should exceed nine years out of 10.
To understand resource assessment errors you need records that are long compared to the 20-year lifetimes for wind plants. Unfortunately, there are very few long-term measurement datasets. ... Such datasets serve many uses, including providing data that can improve basic weather forecasting beyond energy applications."
Recognizing that the industry’s method of estimating future wind power production at a site relies on statistical methods that assume that there is no correlation in wind speeds from year to year, Lundquist’s team measured the P50 and P90 estimated wind power that would be produced at these 60 Canadian sites.
First, the team studied the potential impact of the record length (number of years of observations) might have on estimates of wind power at the 60 sites. They found that the inter-annual variability of winds increased for longer record lengths, which is not what one would expect if the wind speeds each year were independent of each other.
So the group ran a “control” experiment considering the wind speeds out of chronological order. When the order of the yearly wind speeds was randomly shuffled, there was no increase in inter-annual variability in the estimated power production with longer record length.
The best explanation for this finding is year-to year correlation.
In the “experimental” run (with wind-speeds in chronological order), only 13 (compared to the expected 30) of 60 sites had production beating their P50 value.
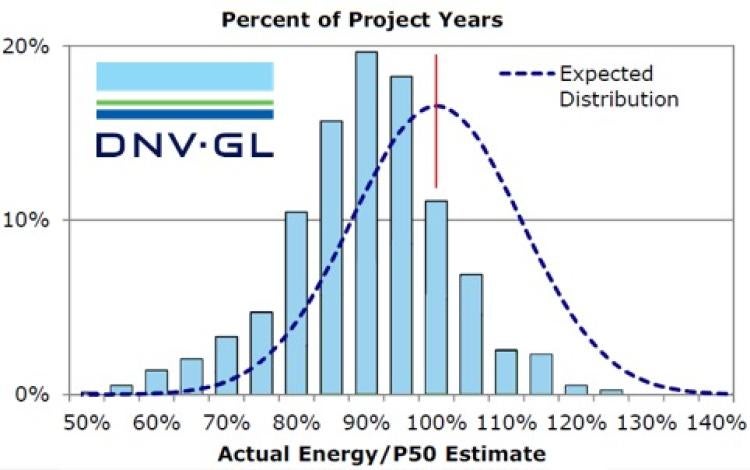
The dotted line illustrates the projected P50 energy output from a wind farm, while the actual production appears in the blue bars, indicating that the wind assessment was too optimistic. Image from DNV GL.
What’s more, the team found that the error in the P50 values gets larger with records longer than four to five years, which is somewhat counter-intuitive, but which again can be accounted for by year-to-year correlation.
Lundquist said the team’s findings help explain the errors in proposed wind-power production. “This analysis is consistent with the complaints from the financial industry that P50 and P90 values fail to represent reality,” Lundquist said.
The research team believes these findings could be used to help develop more-accurate wind-resource assessment techniques.
And Lundquist said the results also underscore the need for long-term measurements of wind, which could help scientists further refine wind-resource assessments.
“To understand resource assessment errors you need records that are long compared to the 20-year lifetimes for wind plants. Unfortunately, there are very few long-term measurement datasets,” she said. “A policy change could address this, perhaps federal policy that requires wind farm developers to make their resource assessment data public as well as maintain their towers over the lifetime of the farm. I understand that European countries have this requirement: Such datasets serve many uses, including providing data that can improve basic weather forecasting beyond energy applications.”
Understanding wakes
Finding: Incoporating a wind-farm paramaterization into the model greatly improves forecast accuracy.
In a separate research effort, with contributions from ATOC graduate students Jessica Tomaszewski, Rochelle Worsnop and Stephanie Redfern, along with colleague Yelena Pichugina of CIRES, Lundquist discussed the efforts to improve an open-source weather prediction model by including the effects of wind turbines themselves on the atmosphere in and near wind farms.
The effects of wind turbines are seen as wakes, downstream wind-speed reduction and turbulence increase. Wakes are represented in the wind farm parameterization, which is incorporated into the Weather Research and Forecasting (WRF) model.
Using data collected in Wind Forecast Improvement Project-2 (WFIP2), a project led by the U.S. Department of Energy and the National Oceanic and Atmospheric Administration, the Lundquist team compared measurements of the atmosphere, such as wind speed, against modeled values of the same variables.
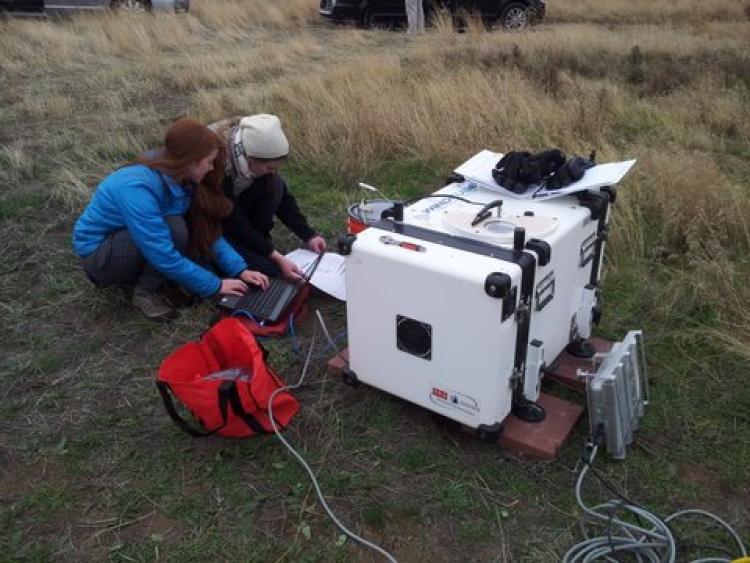
Graduate students Rochelle Worsnop and Clara St. Martin of Lundquist's research group work on a scanning lidar instrument, used to measure wind speed, direction and veer, in Oregon at a Wind Forecast Improvement 2 site. Photo by Joseph Lee.
The WFIP2 field campaign is being conducted in the Columbia River Gorge, an area with complex (not simple or flat) terrain. Ramps, which are difficult-to-predict large increases or decreases in wind speeds that lead to corresponding changes in power production, are modified by turbine wakes.
The study found that the WRF predicts ramps later than ramps actually occur. The study also found that incorporating the wind farm parameterization reduces this forecast error.
In a related line of study, ATOC graduate student Joseph Lee and Lundquist use observations of wind speeds and known values of wind-power production at a 300-megawatt wind farm in Iowa, collected during the 2013 Crop and Wind Energy eXperiment (CWEX), to verify model results.
As in the previous study, Lee explained, this validation study uses a wind farm parameterization to model the effects of wind turbines on the atmosphere.
However, unlike the WFIP2 study, which uses data collected in complex terrain, the CWEX study in Iowa occurred in flat terrain. Lee explained that the wind power predicted by the WRF model without any wind farm parameterization over-estimated the amount of power that the wind farm would produce by at least 40 megawatts, or 13 percent of the potential power production, on average over the four-day period tested.
This over-estimation reflects a large positive bias in the WRF model. However, wind power predicted by the WRF model with the wind farm parameterization eliminates the positive bias and has only a small negative bias of -5 megawatts, yielding more-accurate estimates of wind power than the WRF simulations without the wind farm parameterization.
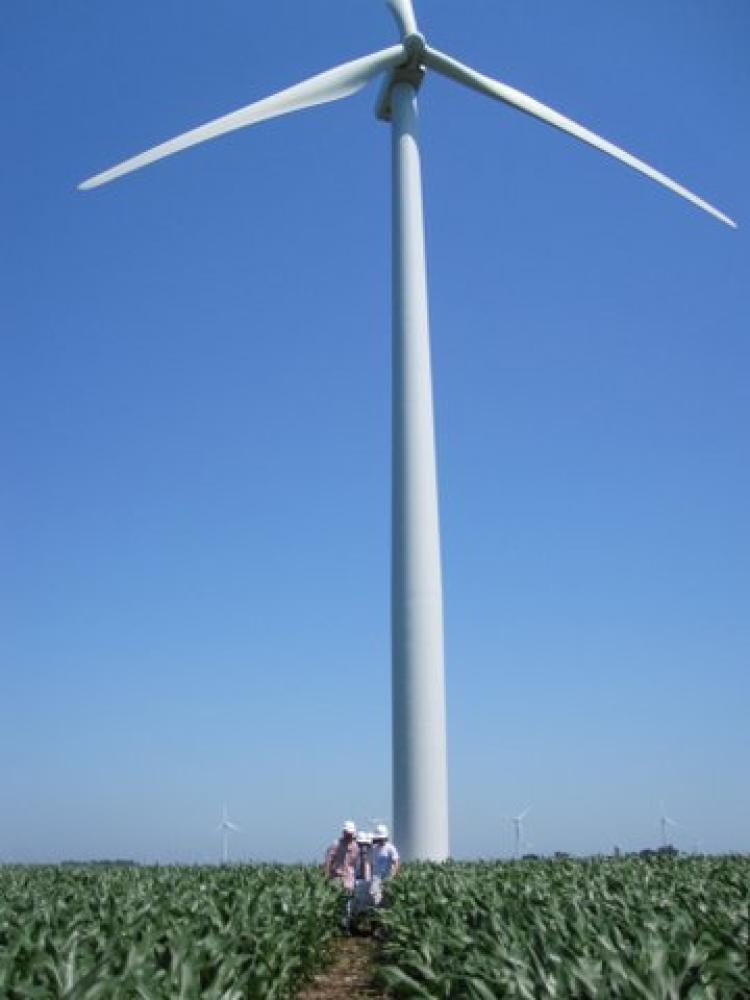
CU Boulder researchers make their way through an Iowa cornfield with a wind turbine overhead. Photo courtesy of Julie Lundquist.
Lastly, Lee’s study found that the error in power estimates is independent of the number of turbines in a grid cell and also not affected by atmospheric stability, i.e., whether the weather is calm or turbulent. These results suggest that modeling the effects of wind turbines on the atmosphere in and near farms will yield more accurate estimates of how much power will be produced at wind farms.
“The impact of using the wind farm parameterization is remarkable, clearly demonstrating that it provides improved forecasts of energy production,” Lee said.
Like Lundquist, Lee emphasized the importance of more data on wind farms. “We had to work hard to acquire the power data I used in the presentation from the wind farm operator in Iowa, building a trusted relationship over several years” Lee said.
“Usually these data are treated as trade secrets. However, in my point of view, making the data available to the science community can help us to improve forecasting models, reduce wind power-production uncertainty, and hence push renewable energy forward.”
Working with Bodini and Zardi, Lundquist performed another study from the 2013 CWEX project. Bodini and the team used data from a scanning lidar instrument, which takes high-resolution measurements of wind speed and direction to look at the effect of changes in wind direction with height (also known as “veer”) on wakes created by operating wind turbines.
They looked at wakes from front-row turbines, because deeper inside the wind farm, the wakes start mixing with one another. In calm weather, the wakes are easy to detect in lidar data, and the wakes from turbines at the ends of the row differ from wakes from turbines in the center of the row. Further, when there are changes in wind direction, the wakes stretch out.
In turbulent weather, turbine wakes erode quickly by vertical movement of air that is found in unstable conditions. These results can be incorporated into current efforts to optimize the placement of individual turbines within a given wind farm to maximize the amount of power produced by the wind farm, and incorporated into models such as the wind farm parameterization model to increase the accuracy of predictions of wind power production.
“The wind-power sector has incorporated research on turbine wakes into wind-farm layout, but the models now used need to be refined,” Lundquist said.
“Understanding wind turbine wakes is an active area of research, and simple wake models are regularly incorporated into wind farm layout design,” Lundquist said. “Our research shows that wakes are much more complicated than those simple models in ways that regularly impact wind farm operations.”
Like a hurricane
At present, the strongest wind turbines are designed to withstand 10-minute mean wind speeds of 50 meters per second (about 111 mph) and three-second gusts of 70 meters per second (about 156 mph), although new international design standards are under discussion. But mean winds much weaker than these in Japan and China have toppled turbines there and ripped off their blades. A Chinese wind farm was hit and damaged by hurricane-force winds twice in 10 years.
“Wind farms are generally designed to last 20 to 30 years, so when they are damaged by hurricane winds in such a short time, it can pose a problem for wind-farm operators and their financers,” Worsnop said.
Worsnop discussed her study about the effects of hurricanes on potential offshore wind turbines. Collaborators on this study include George Bryan of the National Center for Atmospheric Research, Walt Musial and Rick Damiani of NREL, and Lundquist. Worsnop and the team found that current wind-turbine designs would not withstand the most intense hurricanes, including those known to occur in the Gulf of Mexico and the Atlantic Coast south of the Carolinas.
The International Electrotechnical Commission sets standards for engineering and design requirements. The most stringent requirements, currently only set for onshore conditions, are those for turbines that could withstand winds associated with a weak Category 2 hurricane (on the Saffir-Simpson hurricane wind scale) at turbine hub height (about 100 meters). The international commission does not set standards for turbines that could withstand Category 3, 4 and 5 hurricanes.
At present, the strongest wind turbines are designed to withstand 10-minute mean wind speeds of 50 meters per second (about 111 mph) and three-second gusts of 70 meters per second (about 156 mph), although new international design standards are under discussion. But mean winds much weaker than these in Japan and China have toppled turbines there and ripped off their blades.
Using the Cloud Model Version I (CM1) large-eddy-simulation model to simulate hurricane winds that could occur in the lower part of the marine atmosphere where offshore wind farms are being considered for development, the research team found that mean winds and gusts near the eyewall of a hurricane can exceed current turbine design thresholds.

Rochelle Worsnop
The team also found that changing wind direction at hub height, called shear, can challenge turbines as they try to orient themselves or yaw into the predominant wind direction. Turbines designed by IEC standards typically yaw in 10 minutes, but hurricane-force winds can change directions by 10 to 30 degrees in as little as one minute, making it difficult for current turbine yaw systems to keep up, Worsnop said.
Additionally, Worsnop’s team found that wind turbines in hurricanes would encounter veer, which is wind that changes direction with height. Veer is not considered in IEC design standards, Worsnop said, “But we believe it should be, based on our results.”
The next edition of the IEC design standard will have a typhoon/hurricane-resilient subclass of wind turbines, she added. “I hope that our research will further guide this upcoming design subclass to account for gusts, gust factor, and the changes in wind direction that we see in hurricanes.”
The next steps in the hurricane-related research would be to assess the probability of the occurrence of wind conditions that exceed turbine design standards for different regions off the U.S. coast and to determine the combined effect of waves and hurricane winds on offshore wind turbines, Worsnop said.
At the AMS annual meeting, ATOC graduate student Jessica Tomaszewski won a first-place award for her presentation titled “Do Wind Turbines Pose Roll Hazards to Light Aircraft?” Also, graduate student Joseph Lee won third place for his presentation titled “Improvements in Wind Power Forecasts through use of the WRF Wind Farm Parameterization evaluated with Meteorological and Turbine Power Data.” ATOC graduate student Clara St. Martin, who has defended her Ph.D. and just began a wind-resource-assessment position with GE Renewable Energy, also presented on evaluation of the WRF Wind Farm Parameterization in complex terrain. Outside of the energy conference at the AMS annual meeting, Laura Mazzaro presented a poster on “The Influence of Mesoscale, Under-Resolved Convective Structures on Nested Large Eddy Simulations” that provides guidance for simulations to improve forecasting of winds in the atmospheric boundary layer.