
Multivariate Clustering Analysis in R
Course Topics
Multivariate analysis in statistics is a set of useful methods for analyzing data when there are more than one variables under consideration. Multivariate analysis techniques may be used for several purposes, such as dimension reduction, clustering, or classification. The primary goal of this short course is to help researchers who want to understand multivariate data and explore multivariate analysis tools.
In this course, we briefly talk about general multivariate analysis, then concentrate on clustering techniques. The goal of clustering analysis is to establish a set of meaningful groups of similar objects by investigating relationships between objects. For example, if you have data from customers, you may segment customers into clusters based on their buying habits and their demographical characteristics. Then, you can use clustering results to custom tailor your marketing efforts. In this course, we will explore two popular clustering techniques: Agglomerative hierarchical clustering and K-means clustering algorithm. Also, we discuss how to choose the number of clusters and how to visualize the clustering solutions. R software will be used in this course.
This course covers:
- What is clustering analysis? Why is clustering analysis important?
- Agglomerative hierarchical clustering algorithm
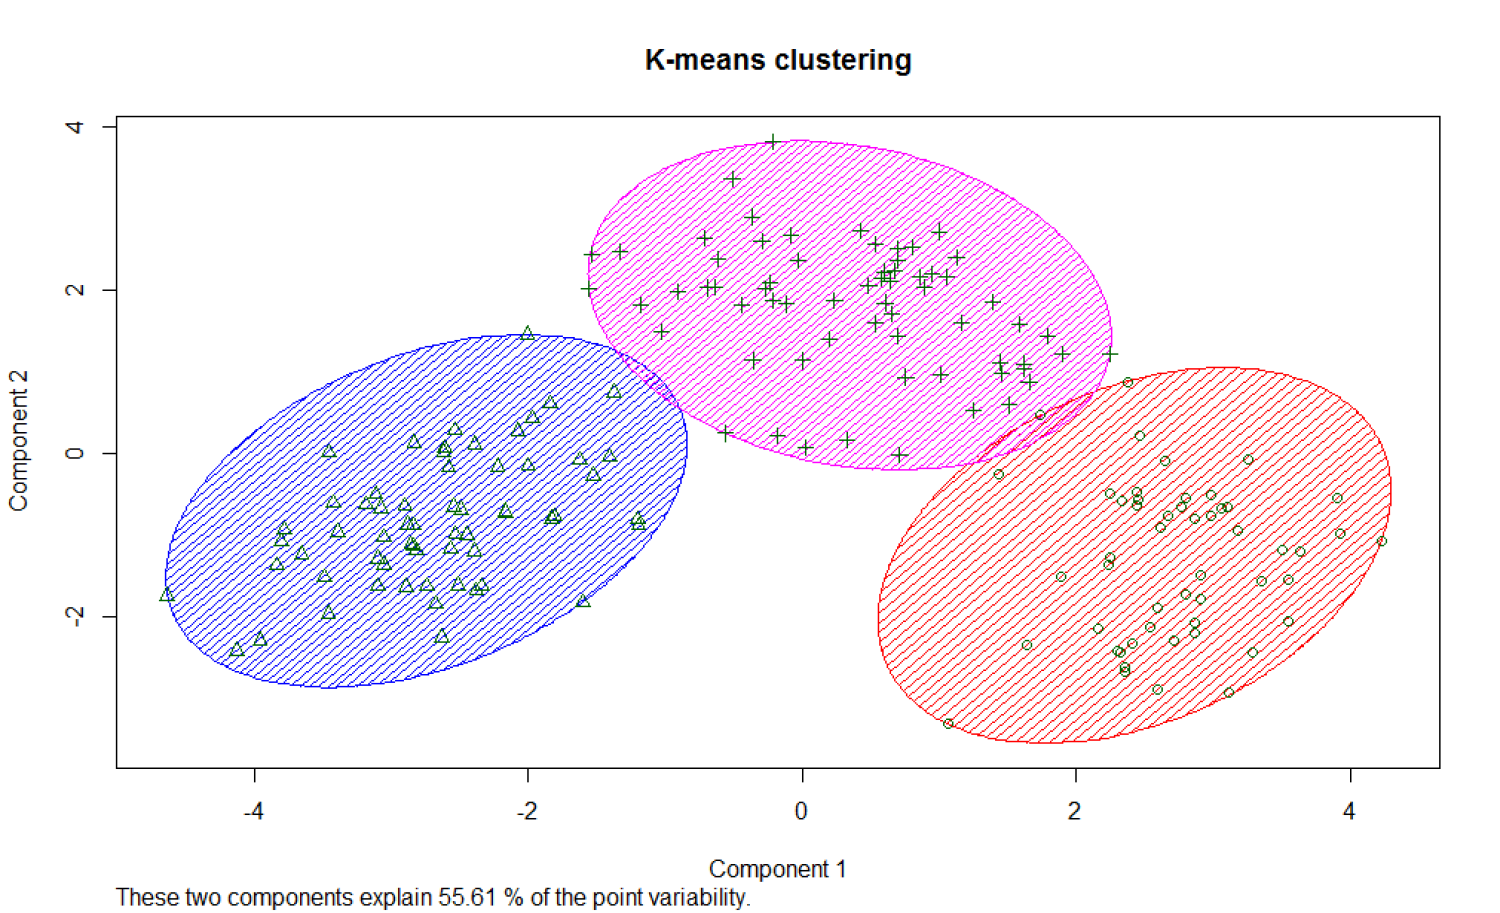
- K-means clustering algorithm
- How do we choose the number of clusters?
- How to visualize the clustering solutions
Data Set:
The data set can be downloaded at http://archive.ics.uci.edu/ml/datasets/Wine. The data set includes 178 wines grown in the same region in Italy. 13 attributes which are chemical analysis results of wines were measured from each wine. We will use this data set for exploring the clustering algorithms.
The graph below shows the clustering results by the K-means clustering method.
[video:https://vimeo.com/135381791]
LISA Short Course: Multivariate Clustering Analysis in R from LISA on Vimeo.