
Multivariate Analysis in R
Course Topics
Multivariate analysis is commonly used when we have more than one outcome variables for each observation. For instance, a survey of American adults’ physical and mental health might measure each person’s height, weight, and IQ. In this scenario, the three outcome variables are measured simultaneously, and you may expect some extent of correlation among the outcome variables (e.g., A taller person may also has a heavier weight). The primary goal of this short course is to help researchers with multivariate data better visualize and understand their data using multivariate analysis tools.
In this course, we will focus on dimension reduction techniques that help reduce the number of variables. We will be mainly talking about two techniques, Principle Component Analysis (PCA) and factor analysis. Note that dimension reduction is different from clustering, where the latter involves methods to place observations into groups. R software will be used in this course.
This course covers:
- Differences between multivariate analysis and univariate analysis
- Differences between dimension reduction and clustering
- Principle Component Analysis (PCA)
- Factor analysis
- Relationship between PCA and Factor Analysis
Data Set:
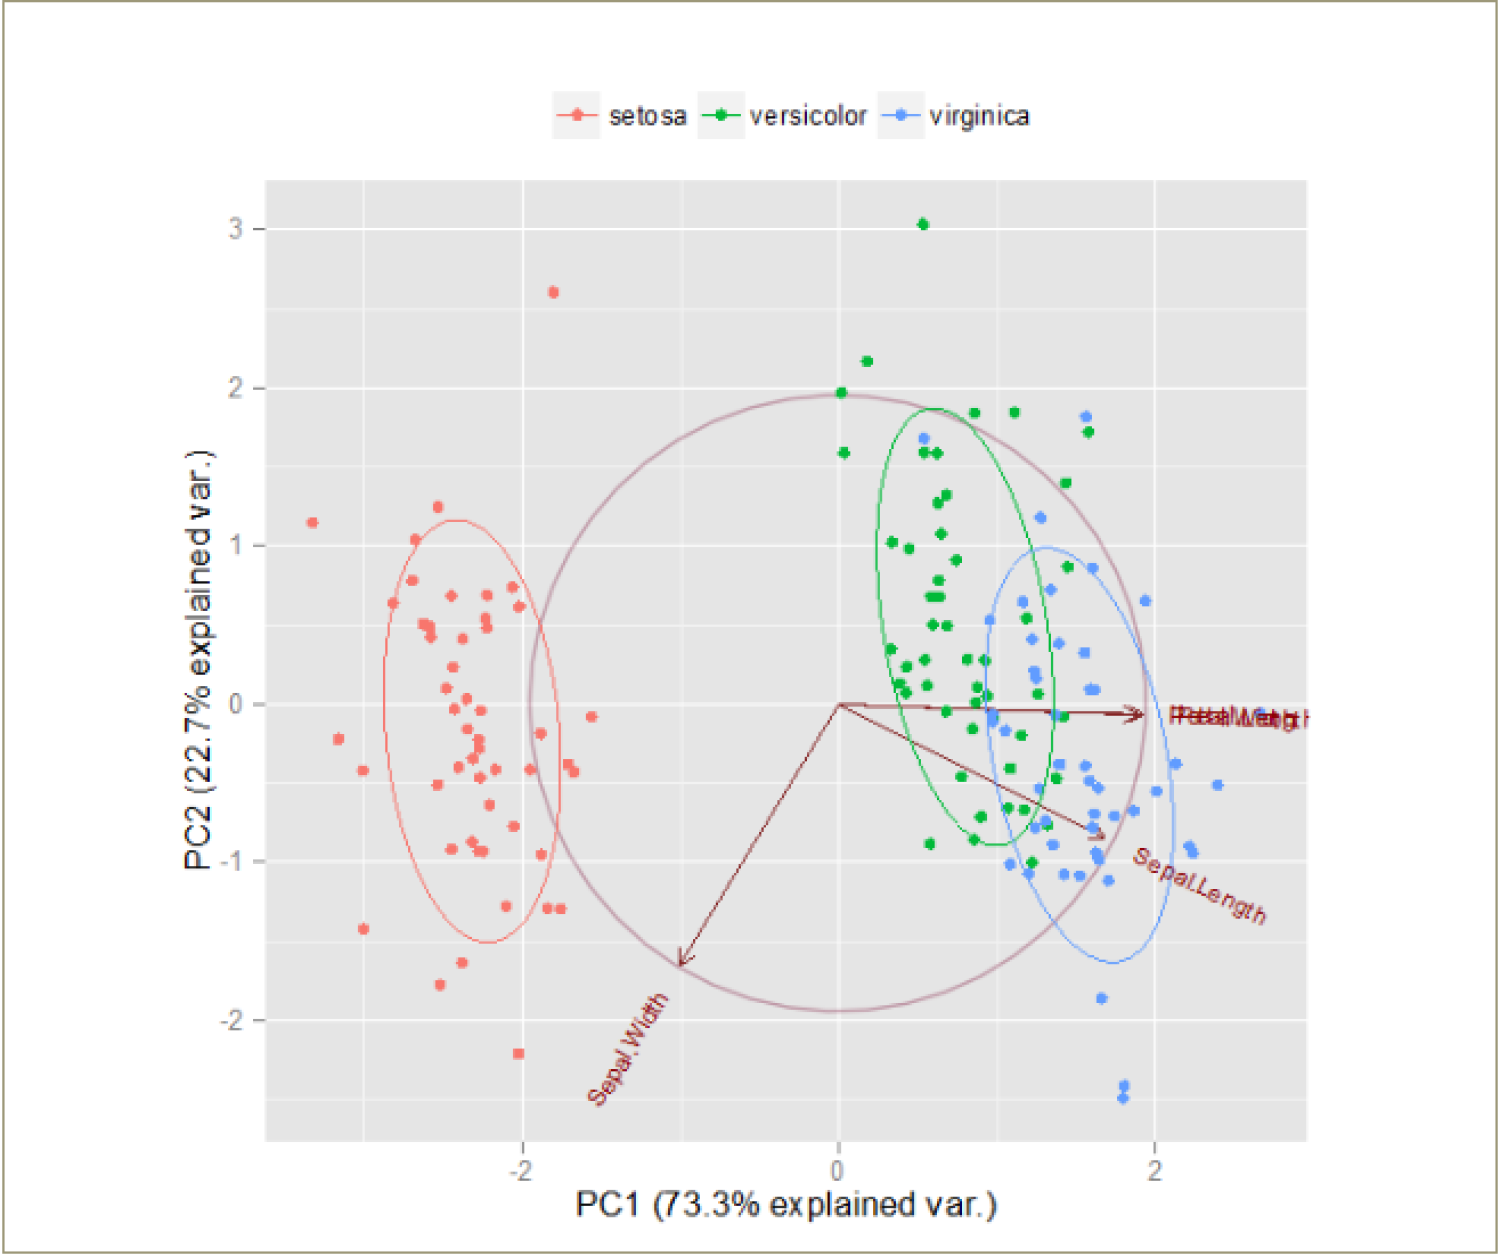
The Iris flower data set will be used for illustration purpose. It includes 50 samples from each of three species of Iris (setosa, virginica and versicolor). Four outcome variables were measured from each sample: the length and the width of the sepals and petals.
The graph below shows the PCA analysis result of the Iris flower data. We will explore and explain more about it in our short course.
[video:https://vimeo.com/122977761]
LISA Short Course: Multivariate Analysis in R from LISA on Vimeo.