
Projects
Quickly jump to Turbulence dissipation rates | Mesoscale Modeling of Wind Farms | Flows in Complex Terrain | Marine Boundary Layers | Observations of Wind Turbine Wakes | Atmospheric Impacts on Energy Production | Large-Eddy Simulations (LES) of the Atmospheric Boundary Layer (ABL) | Wildfire Modeling | LES of the Hurricane Boundary Layer | Mesoscale-microscale Coupling | Assessments of boundary-layer instrumentation | Climate Change Impacts on Energy Production | Urban Meteorology
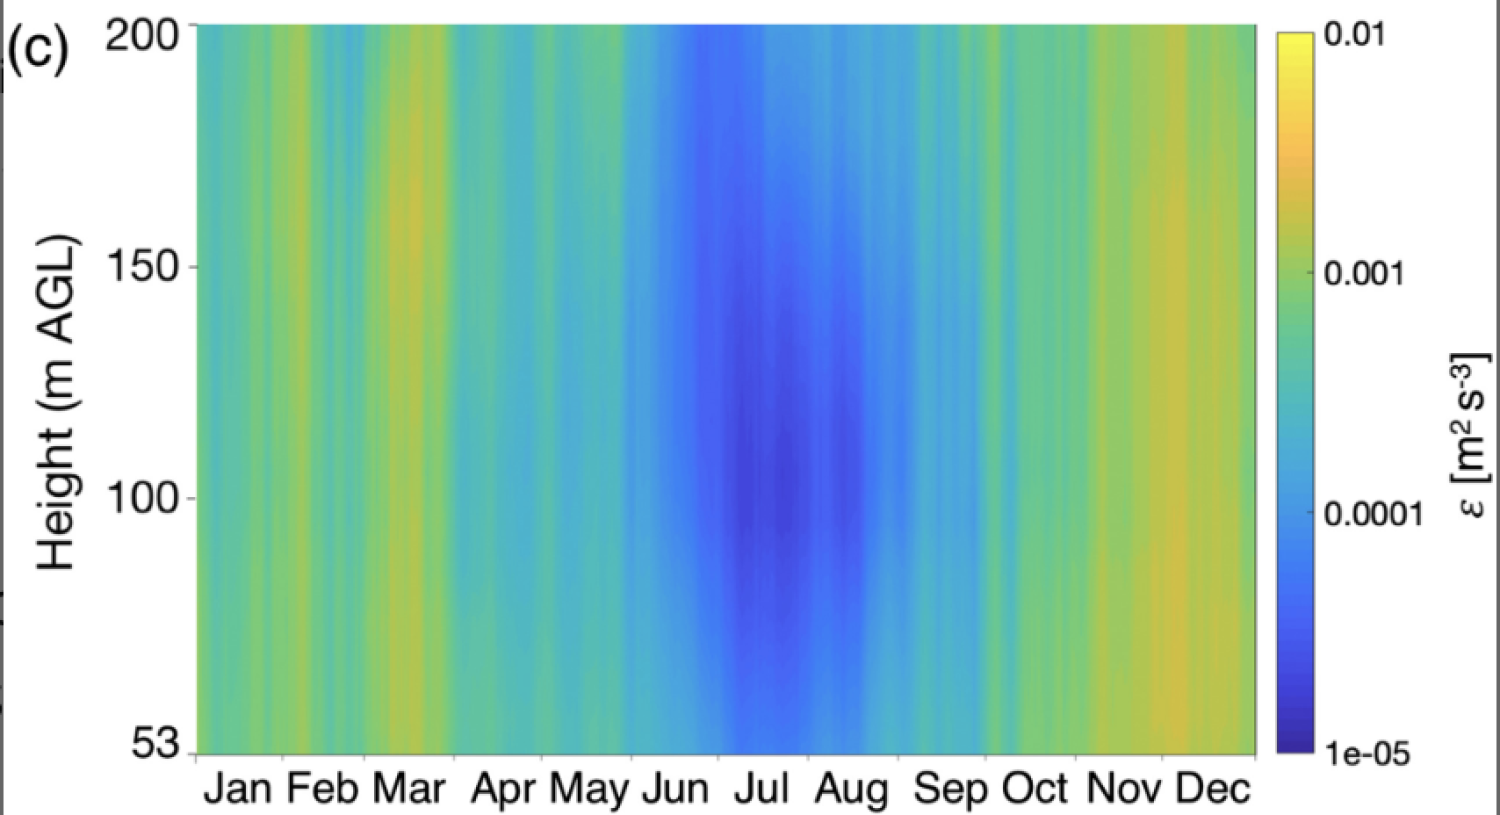
A fundamental challenge in boundary-layer meteorology is how turbulence is dissipated; inaccuracies in the balance of turbulence production and dissipation undermine our ability to simulate atmospheric flows where turbulence is important. With support from NSF via Lundquist's CAREER award, we have developed and demonstrated techniques using lidar to estimate dissipation rate in flat terrain (Bodini, Lundquist, and Newsom 2018 AMT), in complex terrain (Bodini, Lundquist, Krishnamurthy et al. 2019 ACP), in complex terrain with wind turbine wakes (Wildmann et al. 2019 AMT) and offshore (Bodini, Lundquist, and Kirincich 2019 GRL). We used complex terrain datasets to test a machine learning approach for approximating dissipation rate (Bodini, Optis, and Lundquist 2020 GMD). We then expanded this approach for a different complex terrain dataset and other lidar instruments (Sanchez Gomez and Lundquist 2021 ESSD). To better represent turbulence dissipation in numerical models, we are testing existing models (Muñoz-Esparza, Sharman, and Lundquist 2017 MWR) and new modeling approaches (Arthur et al. 2022 JAMC, Rybchuk et al. 2022, in review at WES).

Mesoscale Modeling of Wind Farms
To assess the local and regional impacts of wind energy development, we have implemented a wind farm parameterization into the Weather Research and Forecasting model. The Fitch et a. parameterization (MWR, 2012a, 2012b) is available with every WRF download since version 3.3. In simulations of the CASES-99 GABLS case, the wind farm wake varies throughout the diurnal cycle, with the maximum downwind surface temperature increases ~ 0.5K at night (MWR, 2013) consistent with observations. Comparisons between this elevated drag model and climate simulations representing wind farms simply with enhanced surface roughness show nearly the opposite local impacts on surface temperature (Fitch et al. J Climate 2013). Even in the midst of a very large wind farm, the type of crop surrounding the turbines can impact the wind resource (Vanderwende and Lundquist BLM 2016). Comparisons of these simulations with large-eddy simulations suggest that inclusion of turbine-generated turbulence is essential (Vanderwende et al. JAMES 2016). Using wind farm power production data, we have shown that the use of the wind farm parameterization improves forecasts of power production (Lee and Lundquist GMD 2017). Large-scale climate impacts of wind energy deployment are still being explored (Emanuel et al. 2016). We have extended our wake analysis work to validate modeling tools by comparison to field data (Lee and Lundquist 2017 GMD, Lee and Lundquist 2017 BLM, Siedersleben et al. 2018 MZ, Siedersleben et al. 2018 ERL, and Siedersleben et al. 2020 GMD), tested a rotor-equivalent wind speed formulation in (Redfern et al. 2019 MWR), provided the scientific community guidance on best approaches for simulating wind plant wakes (Tomaszewski and Lundquist 2020 GMD), demonstrated how wakes can affect weather like thunderstorms (Tomaszewski and Lundquist 2021 WES), quantified the financial impact of wakes on neighboring wind farms (Lundquist et al. 2019 Nature Energy), and demonstrated the effects of wakes on long-term observational capabilities (Bodini et al. 2021 Scientific Reports).
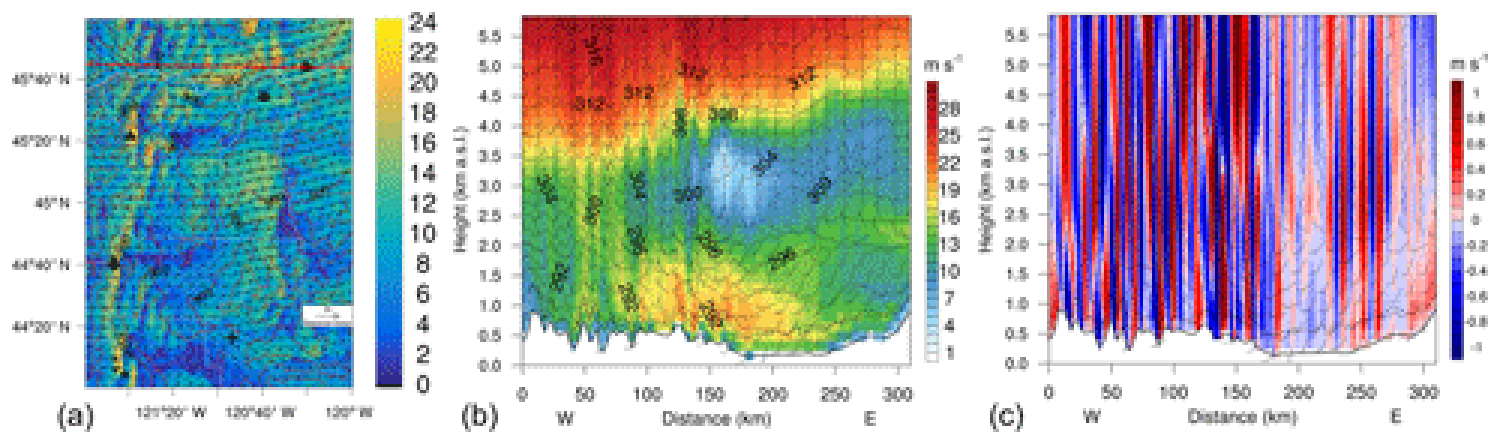
The atmospheric boundary layer behaves very differently in complex terrain, with impacts on wind energy and phenomena like mountain venting. We have recently participated in three experiments in complex terrain. The DOE-funded WFIP2 project sought to improve forecasting models in complex terrain (Shaw et al. 2019 BAMS, Wilczak et al. 2019 BAMS, and Olson et al. 2019 BAMS). One novel aspect of the WFIP2 observations was the documentation of how mountain waves affect wind energy production (Xia et al. 2021 RE, Draxl et al. 2021 WES). We have used these data to test and extend dissipation rate measurements in complex terrain (Bodini, Lundquist, Krishnamurthy et al. 2019 ACP). With collaborators, we are using these data for assessing novel methods for modeling flows in complex terrain (Arthur et al. 2022 JAMC) including statistical forecasting methods (Worsnop et al. 2018 WES) and operational models (Pichugina et al. 2022 in press WAF, Banta et al. 2021 WAF, Djalalova et al. 2020 WAF, Pichugina et al. 2020 JRSE, Bianco et al. 2019 GMD). In the international wind energy complex terrain Perdigão experiment (Portugal 2017, Fernando et al. 2017 BAMS), we deployed a tethered lifting system for unique in-situ measurements of turbulence (TLS) as well as ground-based lidars. We used lidars to characterize complex flows such as recirculation (Menke et al. 2018) and compared lidar and TLS measurements of dissipation rate (Wildmann et al. 2019). Using the TLS and lidar measurements, we evaluated mesoscale-microscale simulation approaches (Wise et al. 2022) in complex terrain. Finally, a small NREL/industry complex-terrain experiment provided new insights for testing wind turbine control strategies in complex terrain, summarized in Fleming et al. 2019 WES, Fleming et al. 2020 WES. We used this dataset (Murphy et al. 2020 WES) to demonstrate the how the atmospheric profile can dictate wind turbine power performance, in contrast to work we have done in simple terrain (Sanchez Gomez and Lundquist 2020 WES).
Beyond extreme events like hurricanes, we are also assessing the characteristics of the marine boundary layer relevant for wind energy. We assessed offshore wind shear and veer profiles (Bodini, Lundquist, and Kirincich 2020 J. Phys. Conf. Ser.). and turbulence dissipation rate data (Bodini, Lundquist, and Kirincich 2019 GRL). We quantified how many offshore wind turbines would be required to match electrical demand in the US Northeast (Livingston and Lundquist, 2020 MetApps), and assessed which reanalysis datasets are best suited for modeling the offshore environment (Pronk et al. 2022 WES). We are funded to collect and analyze a broader dataset via an upcoming Dept. of Energy experiment (WFIP3) for which my students and I will deploy our instrumentation and carry out numerical weather prediction simulations. We have extended our work in wind farm wakes to the offshore environment via comparisons to European offshore wake measurements (Siedersleben et al. 2018 MZ, Siedersleben et al. 2018 ERL, and Siedersleben et al. 2020 GMD). We have also simulated wakes from the planned US offshore wind plant sites, including uncertainty quantification (Rosencrans et al. 2022, in preparation) and multiple boundary-layer models (Rybchuk et al. 2022, in review at WES).

Observations of Wind Turbine Wakes
We utilize profiling lidar (Aitken et al. J Tech 2012, Rhodes and Lundquist BLM 2013, Lundquist et al. AMT 2015, Mirocha et al. JRSE 2015, Lee and Lundquist BLM 2017), scanning lidar (Smalikho et al. J Tech 2013, Mirocha et al. JRSE 2014, Aitken et al. J Tech 2014, Aitken and Lundquist J Tech 2014, Banta et al. J Tech 2015, Bodini et al. AMT 2017), radiometers (Friedrich et al. GRL 2012, Bianco et al. AMT 2017), meteorological towers (Vanderwende and Lundquist ERL 2012, Clifton et al. JSEE 2013) and tethered lifting systems (Lundquist and Bariteau BLM 2015) to study the development and propagation of wind turbine wakes in different atmospheric conditions, with special interest in wind farms co-located with agriculture (Rajewski et al. BAMS 2013, Rajewski et al. AFM 2014). Our algorithms for wake characterization are publicly-available at https://github.com/nicolabodini/CWEX13.
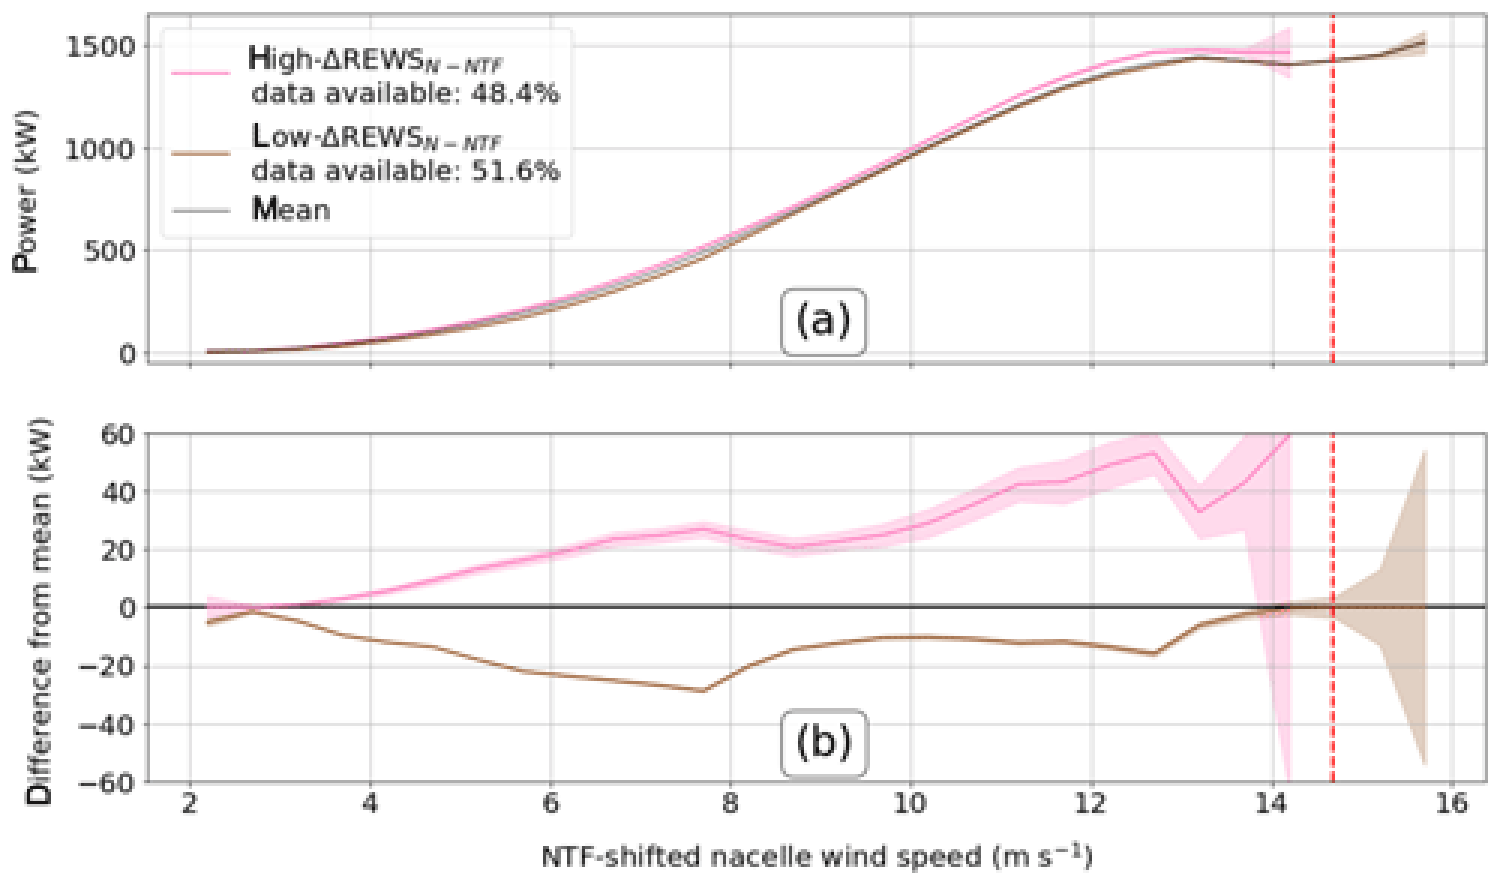
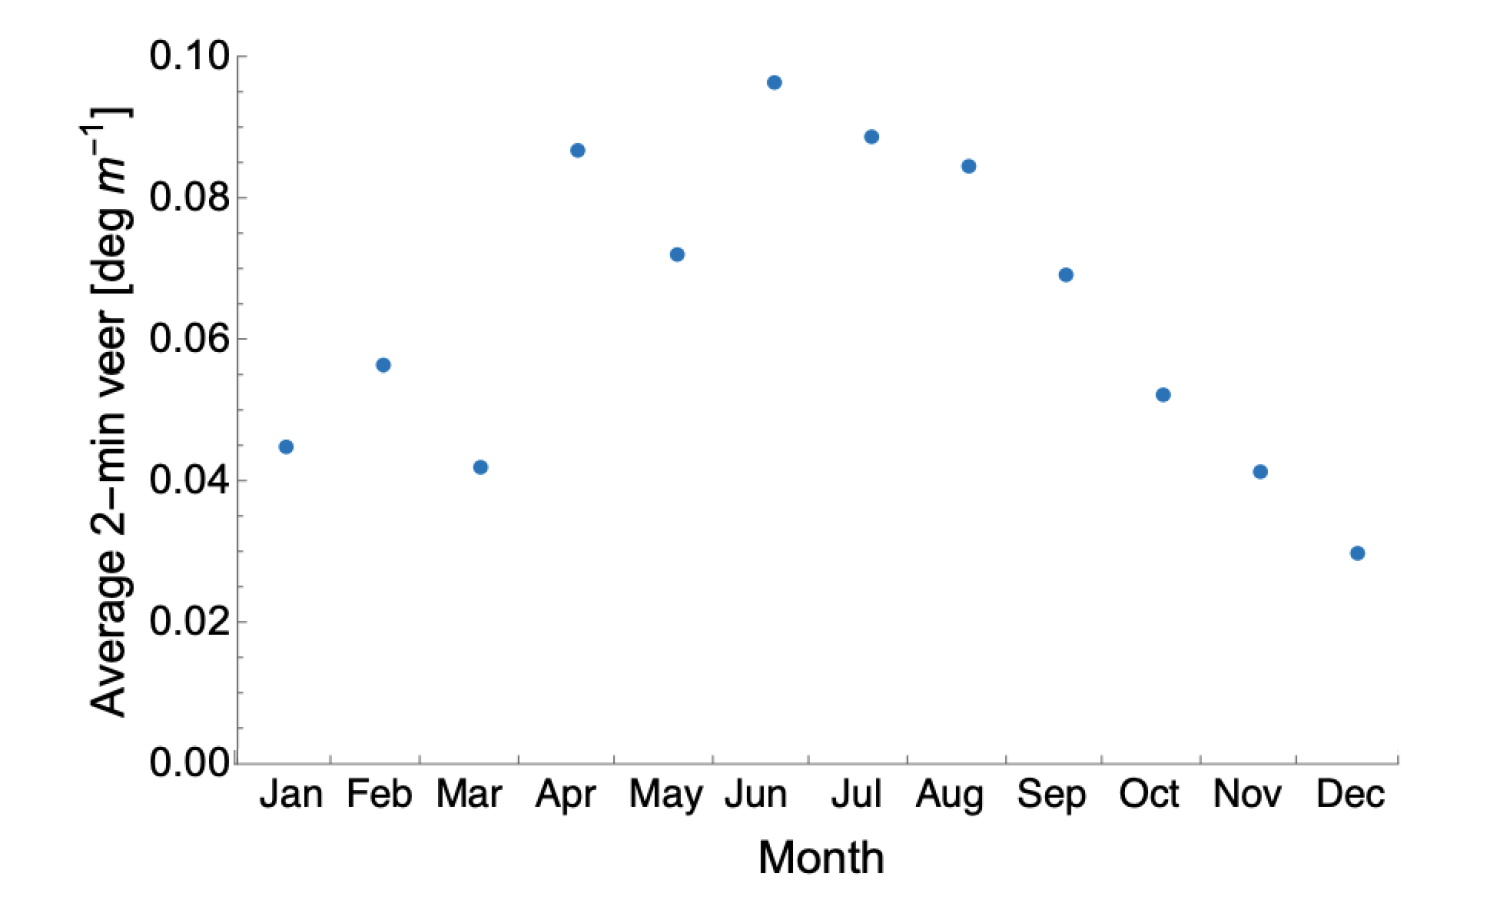
Atmospheric stability impacts wind turbine power production (Wharton and Lundquist WE 2012, St, Martin et al. WES 2016) sometimes in contradictory ways (Wharton & Lundquist ERL 2012 vs Vanderwende & Lundquist ERL 2012) depending on local meteorology. Neural networks can extend limited measurements at a site towards improved resource assessment (Clifton et al. ERL 2013). Detailed lidar observations and WRF simulations of nocturnal low-level-jets (LLJ) (Vanderwende et al. MWR 2015) suggest that LLJ-induced wind shear and veer extend into the turbine rotor-layer during intense jets. This wind shear and veer varies with stability and impacts power production (Sanchez Gomez and Lundquist 2020a, 2020b) At large spatial scales, we evaluate the statistical independence of wind generators, and find that higher-rate fluctuations in wind power generation can be effectively smoothed by aggregating wind plants over areas smaller than otherwise estimated (St. Martin et al. ERL 2015). For wind resource assessment of P50 and P90 levels, interannual variability is influenced by data record length, with counter-intuitive suggestions for ideal record length (Bodini et al. WES 2016). We assess methodologies for long-term wind resource assessment (Lee et al. 2018). Further, wind turbine nacelle measurements are also affected by atmospheric stability (St. Martin et al. WES 2017) as is power production (Murphy et al. 2020).

Improved turbulence models (MWR 2010b) and/or immersed boundary methods (MWR 2010a, MWR 2012) may be required to simulate complex flow in stable atmospheric boundary layers or in regions of complex terrain. To elucidate interactions of atmospheric stability with wind turbine wakes, large-eddy simulations with a generalized actuator disk model (Mirocha et al. JRSE 2014, Aitken et al. JRSE 2014, Mirocha et al. JRSE 2015) demonstrate how ambient turbulence accelerates the erosion of wind turbine wakes. These LES of turbine wakes can be used to evaluate mesoscale parameterizations of wind farm effects (Vanderwende et al. JAMES 2016). Additionally, we validated LES in comparison to field data for dispersion experiments (Rybchuk et al. 2021 MWR) and for heterogeneous experiments incorporating wind turbines in the flow (Wise et al. 2022 WES, Sanchez Gomez et al. 2022 in review JRSE). We use finer-resolution simulation tools to represent individual turbines and can assess the impact of the wind profile and atmospheric stability on wakes (Marjanovic et al. 2017 JRSE) and how those wakes decay and affect downwind environments (Tomaszewski et al. 2018 WES). The wind veer and wind shear characteristic of nighttime environments interacts with the direction of turbine rotation in complex ways (Englberger, Lundquist, Dörnbrack, 2020; Englberger, Dörnbrack, Lundquist, 2020).
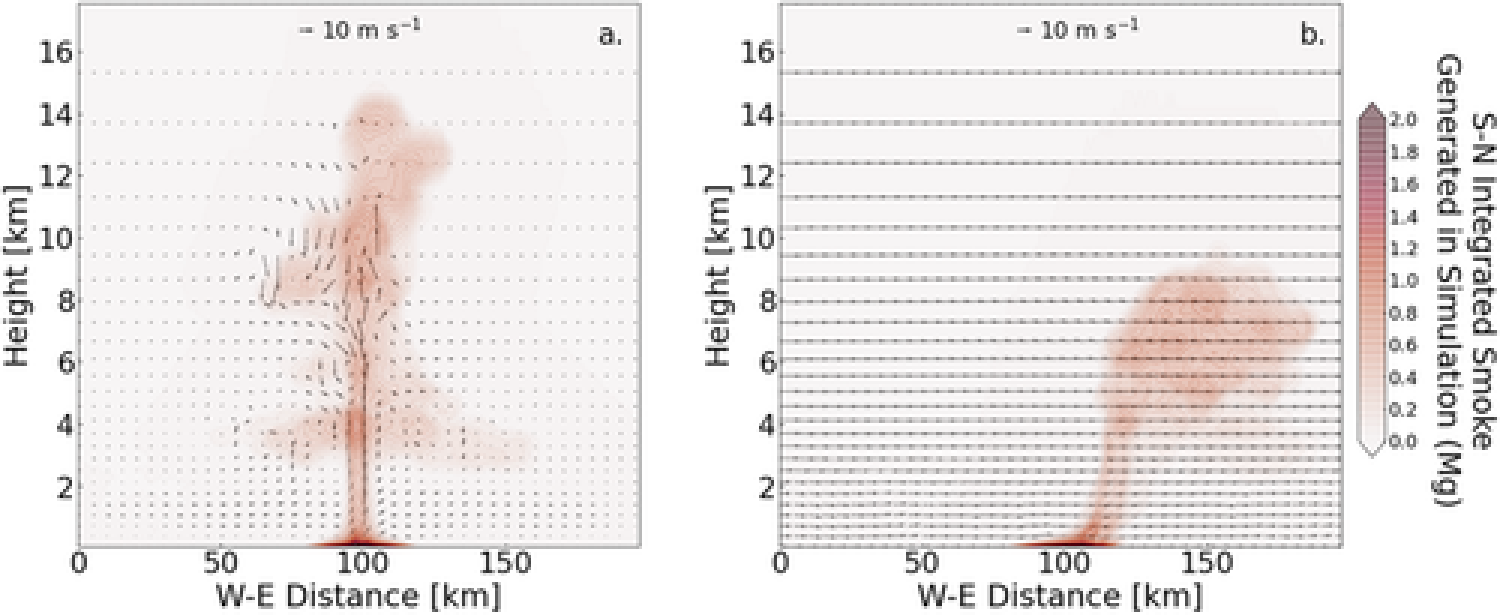
Smoke lofting from a fire changes with varying local winds, relative humidity, and atmospheric boundary-layer stability, and the presence of moisture can raise the altitude of lofting, while faster wind speeds dampen lofting (Redfern et al. 2020 JGR).

To better understand the environment for offshore wind turbines, detailed large-eddy simulations can provide information about turbulence structures that observations simply cannot. We have developed (Bryan et al. BLM 2017) and verified (Worsnop et al. 2017a) a simpler LES approach and used these simulations to quantify gust factors for wind turbine design (Worsnop et al. 2017b) to help improve turbine design standards for offshore wind turbines. Working with structural engineers, we have used these data to assess loads on wind turbines (Kapoor et al. 2020).

Simulations provide an important tool for understanding and predicting the atmospheric boundary layer, but we need to incorporate both realistic large-scale weather effects (mesoscale) as well as refined localized turbulent variability (microscale) with large-eddy simulations, transcending previous idealized approaches. We have investigated and tested new approaches for simulations across scales (Mazzaro et al. 2017 JAMES, Mazzaro et al. 2019 JAMES). We have demonstrated such coupling for a diurnal cycle in a wind farm, facilitated with cell perturbation methods (Muñoz-Esparza et al. 2017).

The US Dept of Energy supported an experiment, XPIA, to assess the ability of current instrumentation to measure wind farm flows (Lundquist et al. BAMS 2017). This dataset allowed for detailed investigations of the performance of radiometers (Bianco et al. AMT 2017 ), scanning lidars (Choukulkar et al. AMT 2017, Debnath et al. AMT 2017a) and their uncertainty (Newsom et al. AMT 2017), comparisons of scanning lidars with dual-Doppler radar (Debnath et al. AMT 2017b), and even meteorological tower wakes (McCaffrey et al. AMT 2017). Data from the XPIA campaign may be downloaded from https://a2e.energy.gov/projects/xpia. We have assessed lidar capabilities for measuring wind turbine wakes (Bodini, Zardi, and Lundquist 2017 AMT), quantified measurement strategies for airborne lidar measurements (Gasch et al. 2020 AMT), and developed a lidar simulator (Robey and Lundquist 2022 AMT, in press) and lidar error assessment tool that is now in use for designing upcoming field experiments (Sanchez Gomez et al., 2022, in review at JRSE).
Climate Change Impacts on Energy Production
Cities can create their own microclimates with interesting implications for detailed simulations of flow in urban areas (Lundquist and Chan JAMC 2007; Lundquist and Mirocha JAMC 2008), mixing-length heights (Simpson et al. AE 2007), and air pollution events (Hu et al. JAMC 2013), especially when urban meteorology interacts with nocturnal low-level jets (LLJ). Immersed boundary methods may be required for simulations in urban areas (Lundquist, Chow, and Lundquist MWR 2010, 2012).