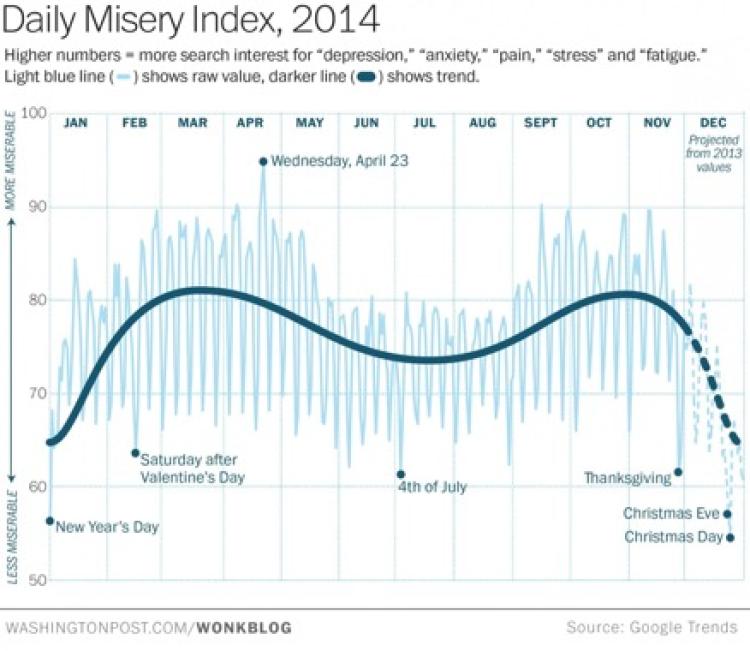
November is a time of beautiful fall colors, of giving thanks, and of that glorious fall break we’re all itching to get our hands on. However, according to the Washington Post, it’s also one of the most miserable months of the year. In this article, Ingraham displays the “Daily Misery Index,” a combination of results for rates of depression, anxiety, pain, stress, and fatigue. The numbers are surprisingly highest in the spring and fall and lowest during the holidays; the numbers also ebb in the summer. However, the graph is clear – fall and spring rates show the highest rates of misery. In a weekday breakdown, Monday rates highest for pain and anxiety, Tuesday for stress and depression, and Wednesday for fatigue. These rates drop dramatically over the weekend, with a slight rise on Sunday. So, it looks like weekdays during the months of October and November are most miserable for the average American.November is a difficult time for students, and it’s important to recognize that we may all be struggling through this month for a variety of different reasons - illness, midterms season, elections, etc. It’s important to find methods to destress, such as physical methods like exercise and diet, and mental methods like meditation and unplugging from electronic devices. To be aware that these strategies may come more in handy over the fall is a means of preventative self-care, something that can greatly positively affect one’s mental health over the stressful spring and fall seasons.
Source:
https://www.washingtonpost.com/news/wonk/wp/2014/12/03/the-google-misery-index-the-times-of-year-were-most-depressed-anxious-and-stressed/?utm_term=.c6ef7d32784e