
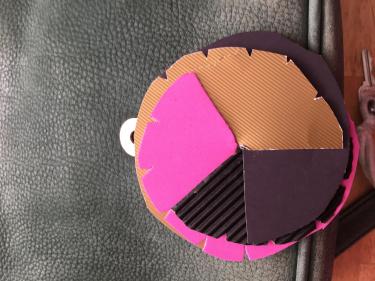
Tactile Pie Chart
Design Criteria for Tactile Graphics
When creating tools for tactile graphing remember:
- Texture is important for distinguishing between data sets.
- Make everything large enough to feel. Your fingers will be your eyes so if you can't feel it, you can't 'see' it.
- It is more powerful if you have a tool that can be used for multiple different data sets, so try to make your designs adaptable.
Project Resources:
Download files for a 3D model tactile pie chart graphing tool.