
Graphical Policy Analysis Tool
For planning studies that consider risk and reliability, it is useful to run ensembles of hydrologic inputs and perform statistical analysis on the results to get probabilistic output, much like a Monte Carlo simulation. RiverWare includes a utility called Multiple Run Management (MRM) that sets up and executes multiple runs automatically and sends the results to output files that can be analyzed by postprocessing programs. Using MRM, the user can make many runs over a planning horizon, using many traces of stochastically generated hydrologic inputs. MRM exports the results of the runs to one or more files in RiverWare Data Format (RDF). Postprocessing analysis programs can then import the RDF files and generate probabilistic information about the occurrence of certain events or the effectiveness of proposed operating policies. The hydrologic traces can be generated by the Hydrology Simulator.
With the use of the Graphical Policy Analysis Tool (GPAT), an Excel-based tool developed jointly by CADSWES and the Bureau of Reclamation, the output of stochastic MRM can be used to compare two or more proposed operating policies in terms of their probabilistic effects on specified basin measurement criteria.
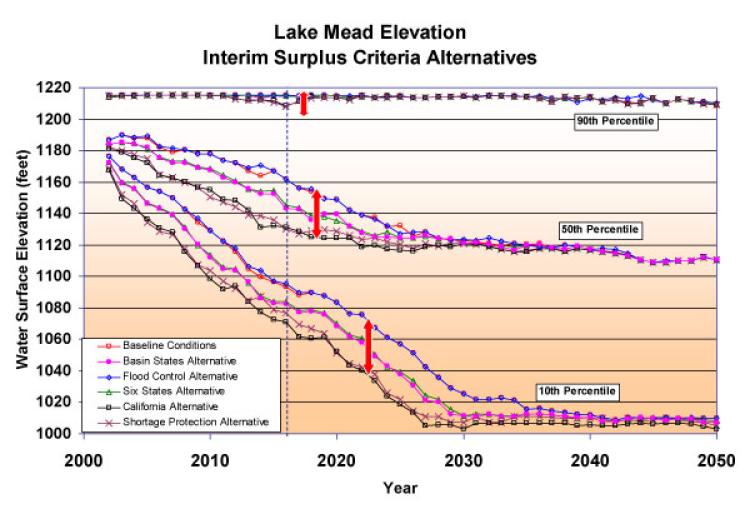
In environmental impact studies, the measurement criteria may include a stream flow or lake elevation that is expected to comply with biological recommendations. To use GPAT for policy comparison, the multitrace runs are performed for each policy alternative, and the results are imported into GPAT. GPAT can provide statistical information in various ways over time, hydrologic trace and policies. The figure shows an application of GPAT on the Colorado River for the Interim Surplus Environmental Impact Statement. The plot shows how six different operating policies compare with respect to the long-term elevation of Lake Mead and different confidence levels. Each policy was modeled with the stochastic hydrologic traces, all starting with the same initial conditions in January 2000.