
First-Generation College Student Engagement
Fall 2023 Semester Highlights & Survey Data 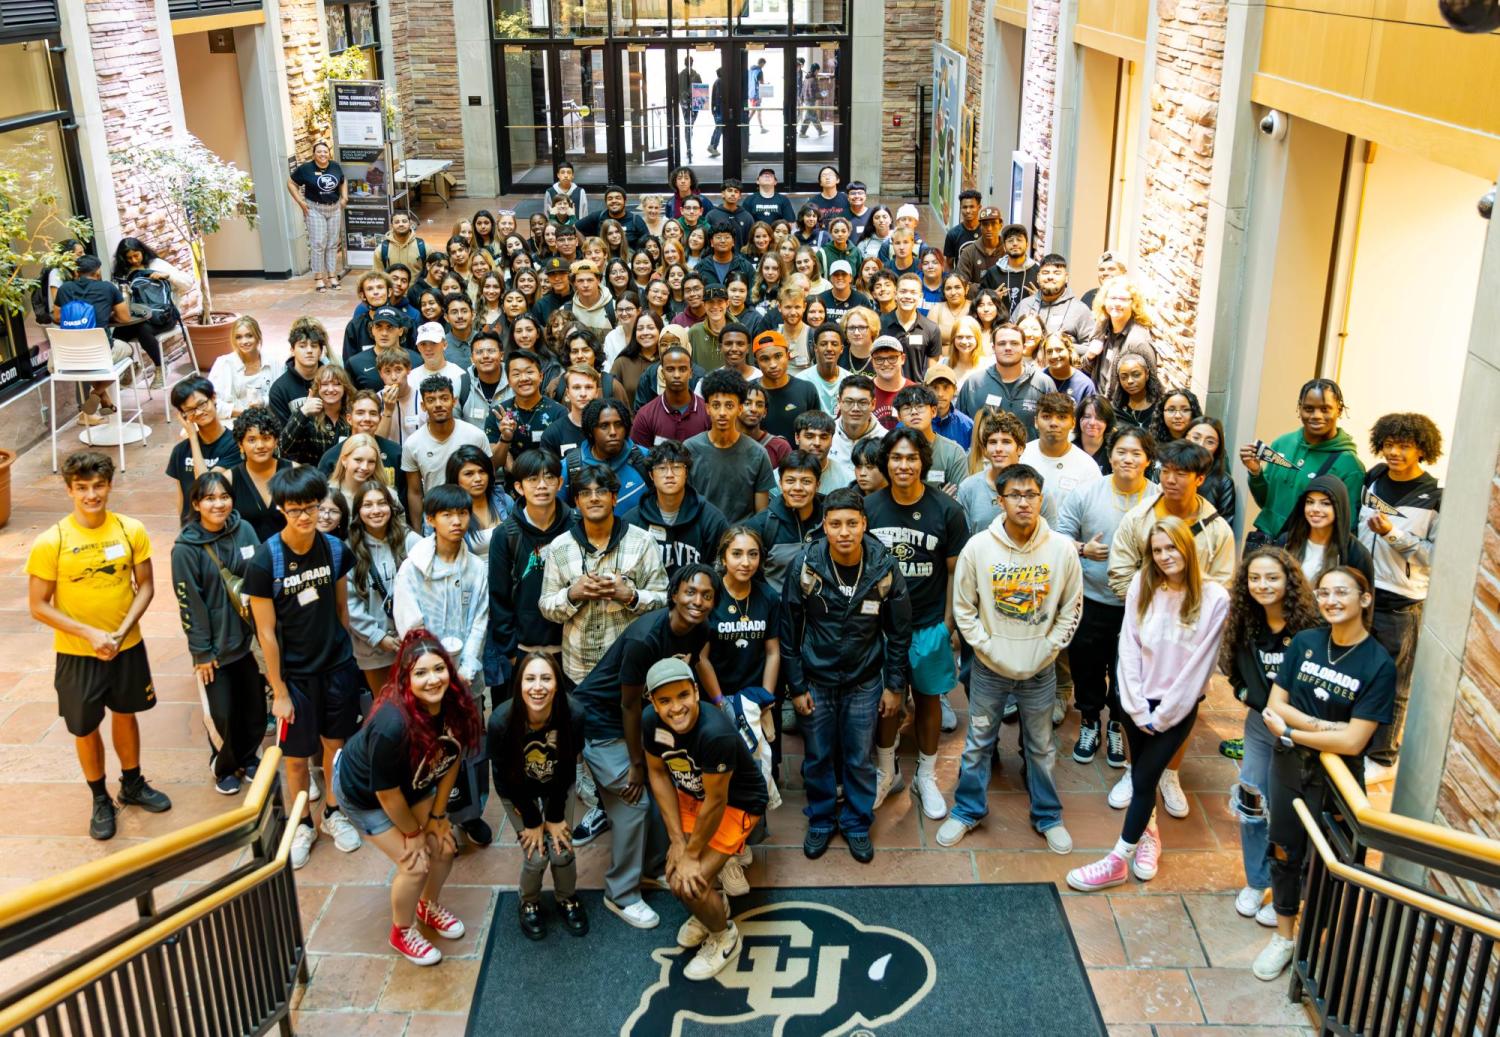
The First-Generation Programs & Enrichment Office and campus partners hosted a diverse group of students, faculty, and staff this past semester, attending a range of events, from orientation and career support, to a celebration of all first-gen students.
We asked participants if they felt affirmed and celebrated in their identity as a first-generation college student in some of our post-event surveys. 91% of participants who responded to that question agreed or strongly agreed.
CISC First-Gen event participant details:
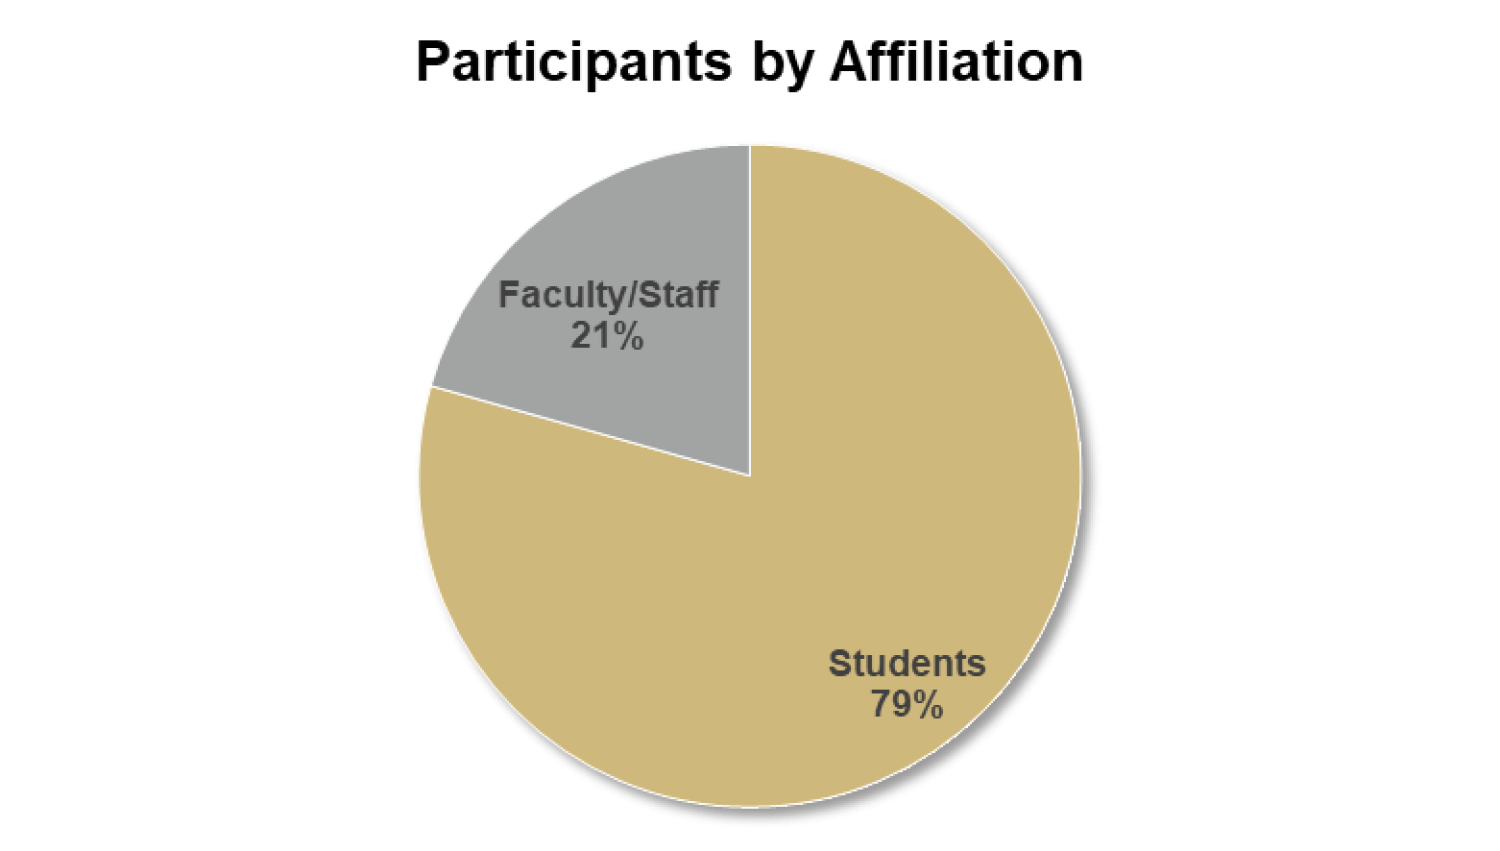
- 79% students, 21% faculty or staff participants
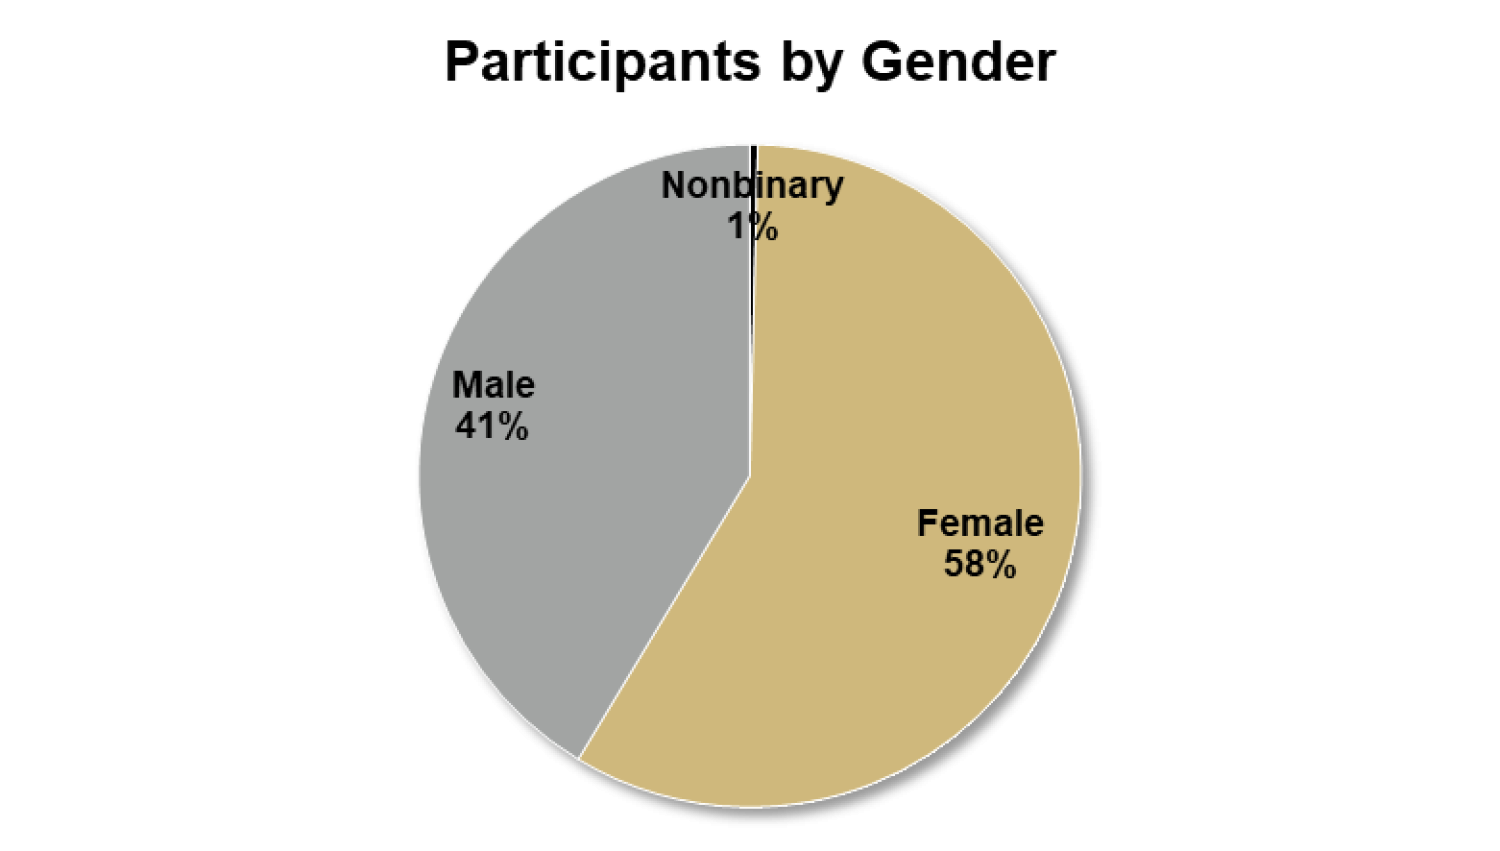
- 58% female, 41% male, 1% nonbinary participants
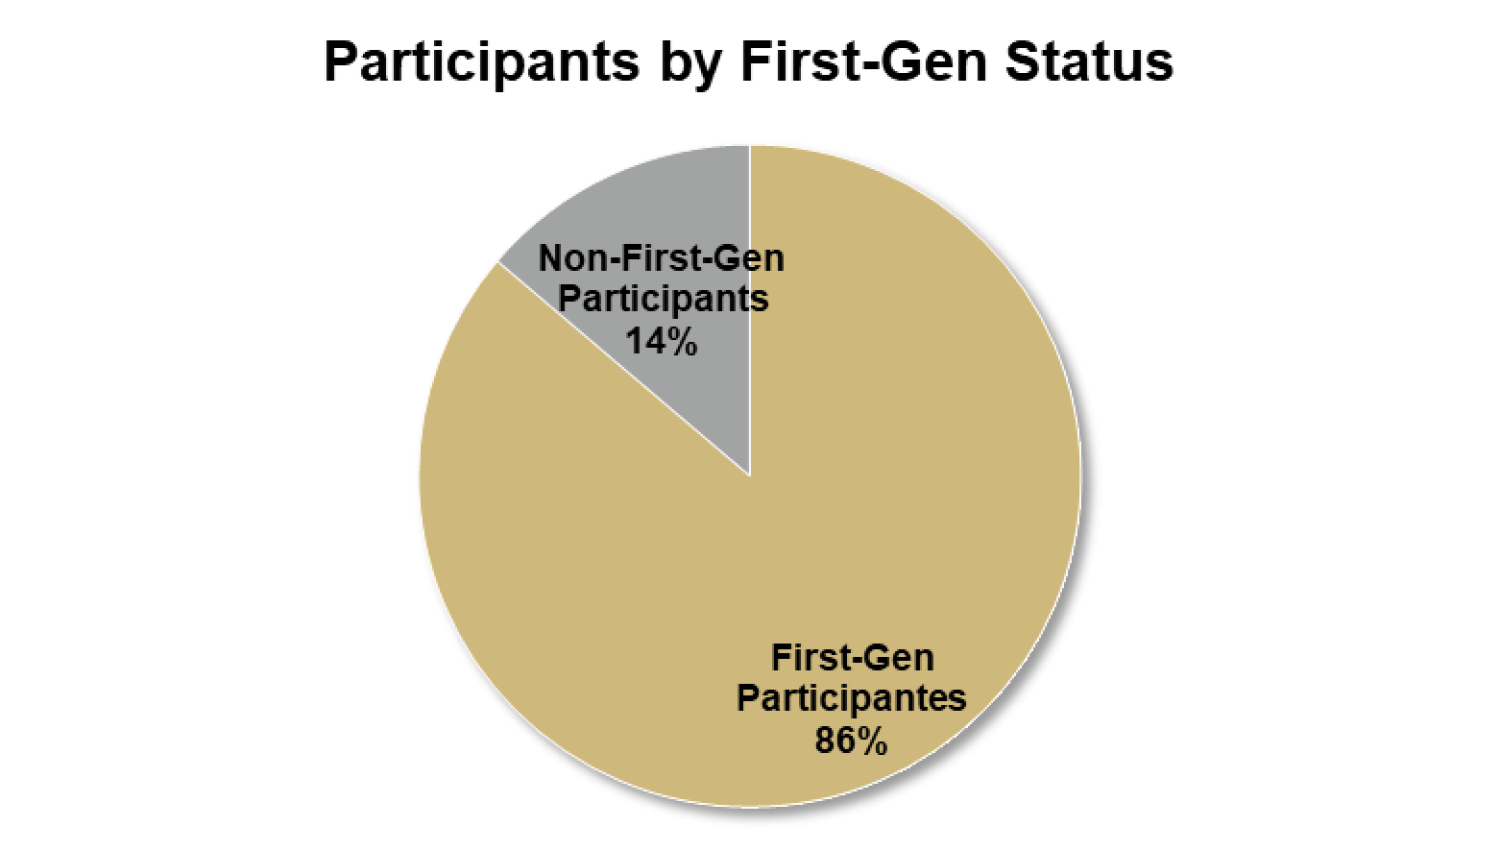
- 86% first-gen students, 14% non-first-gen students
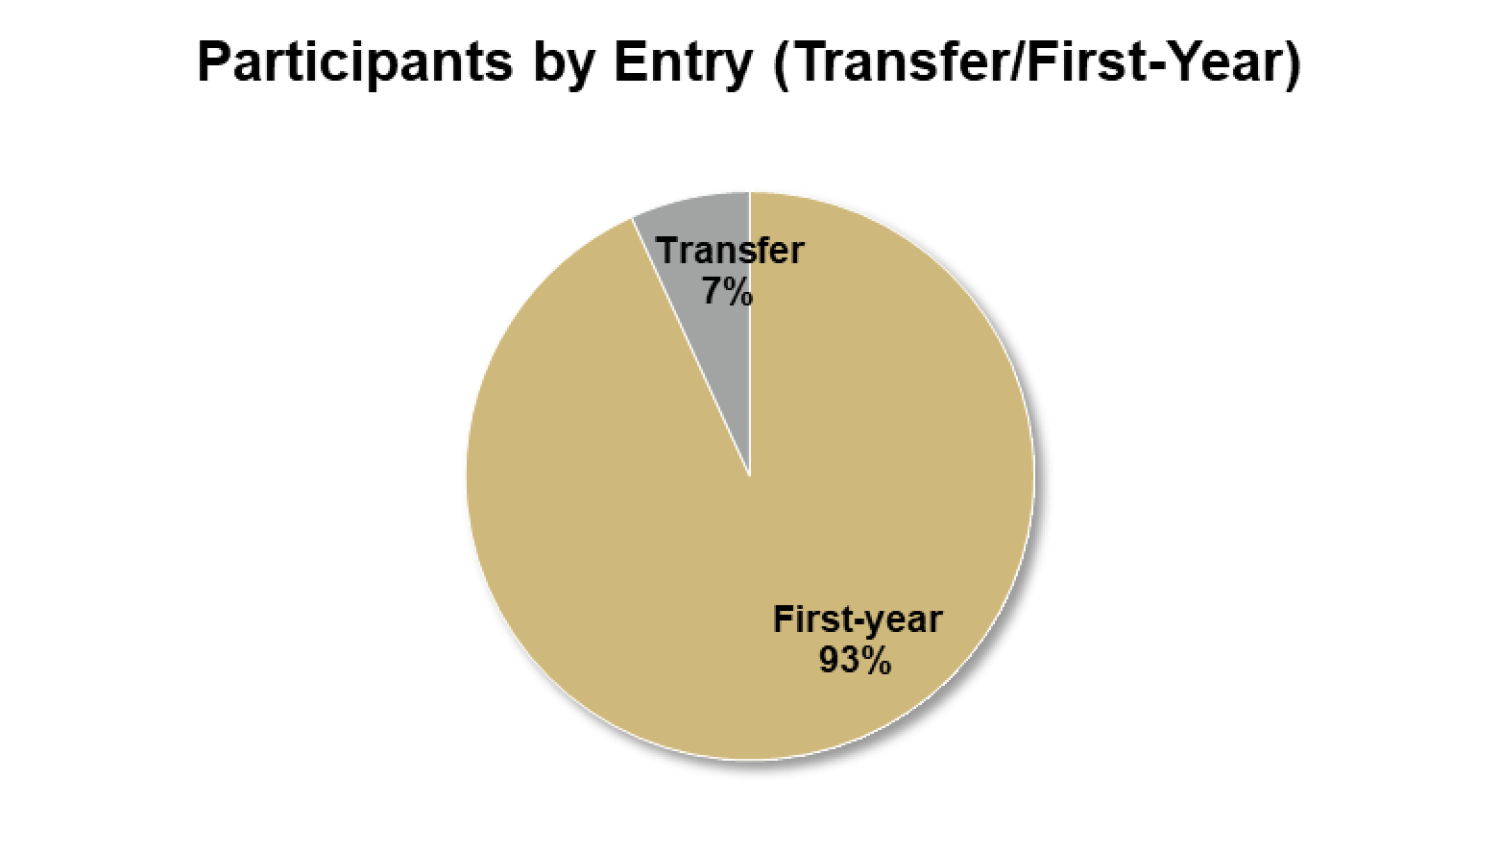
- 7% transfer students, 93% first-year entry students
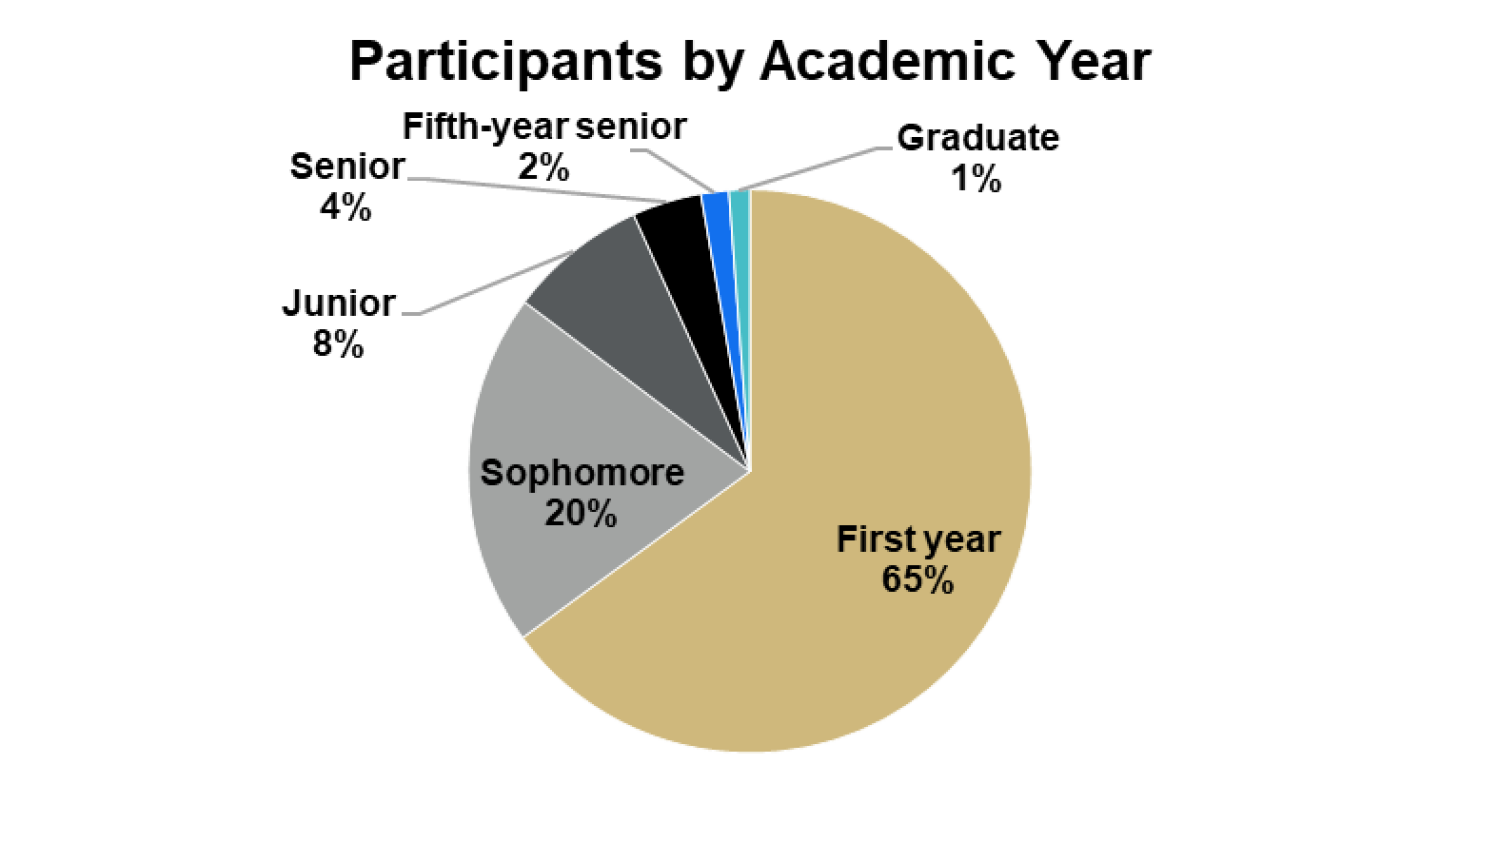
- 65% first-year, 20% sophomore, 8% junior, 4% senior, 2% fifth-year seniors and 1% graduate students
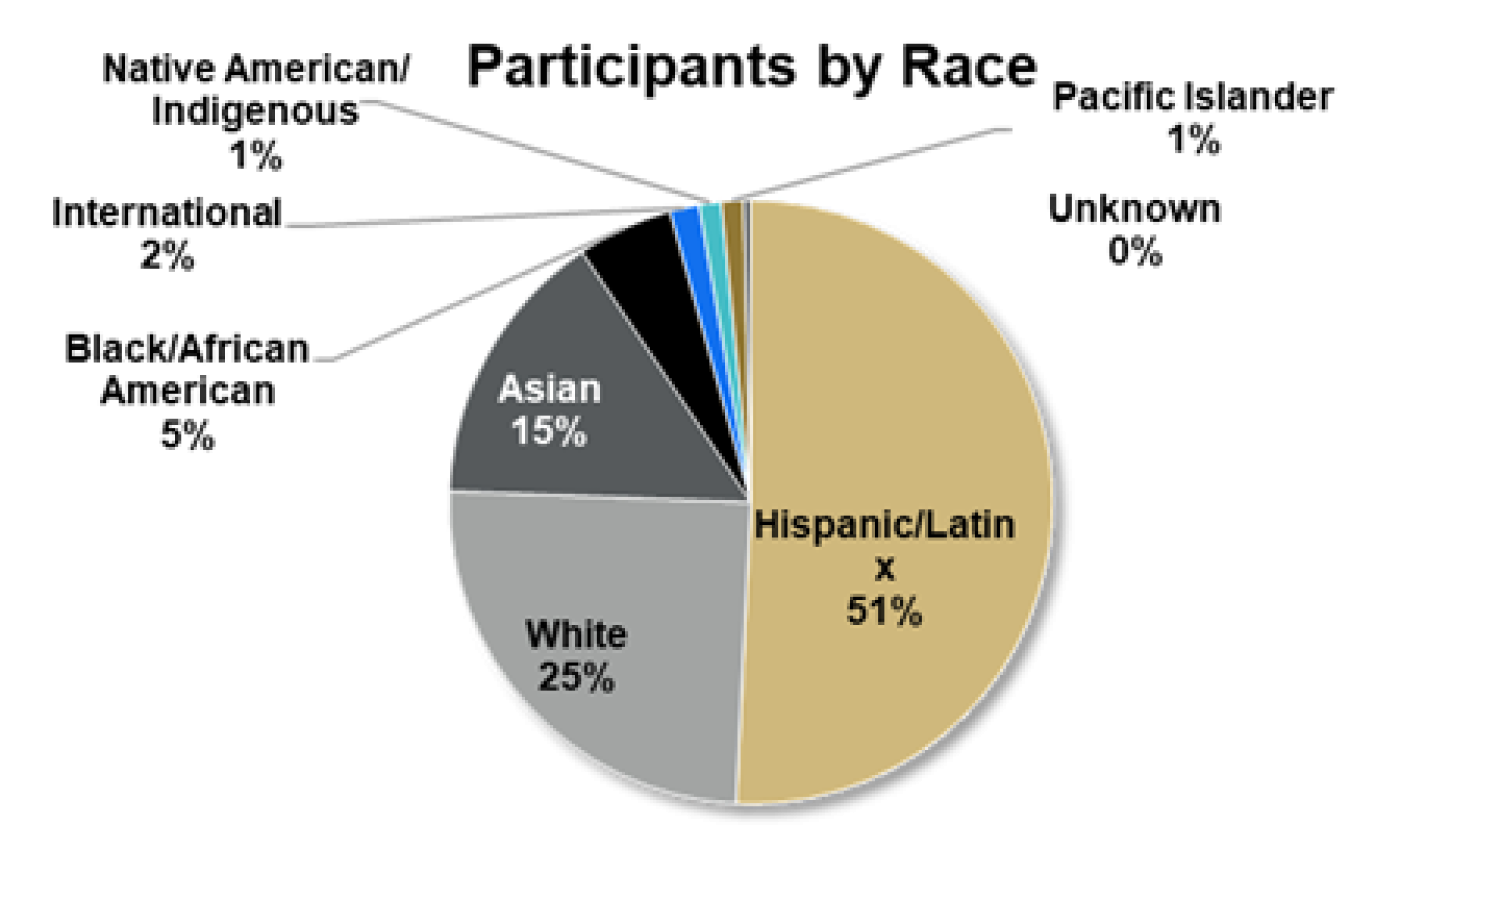
- 50.8% Hispanic/Latinx, 24.8% White, 15% Asian, 5.1% Black/African American, 1.6% International, 1.2% Native American/Indigenous and 1.2% Pacific Islander
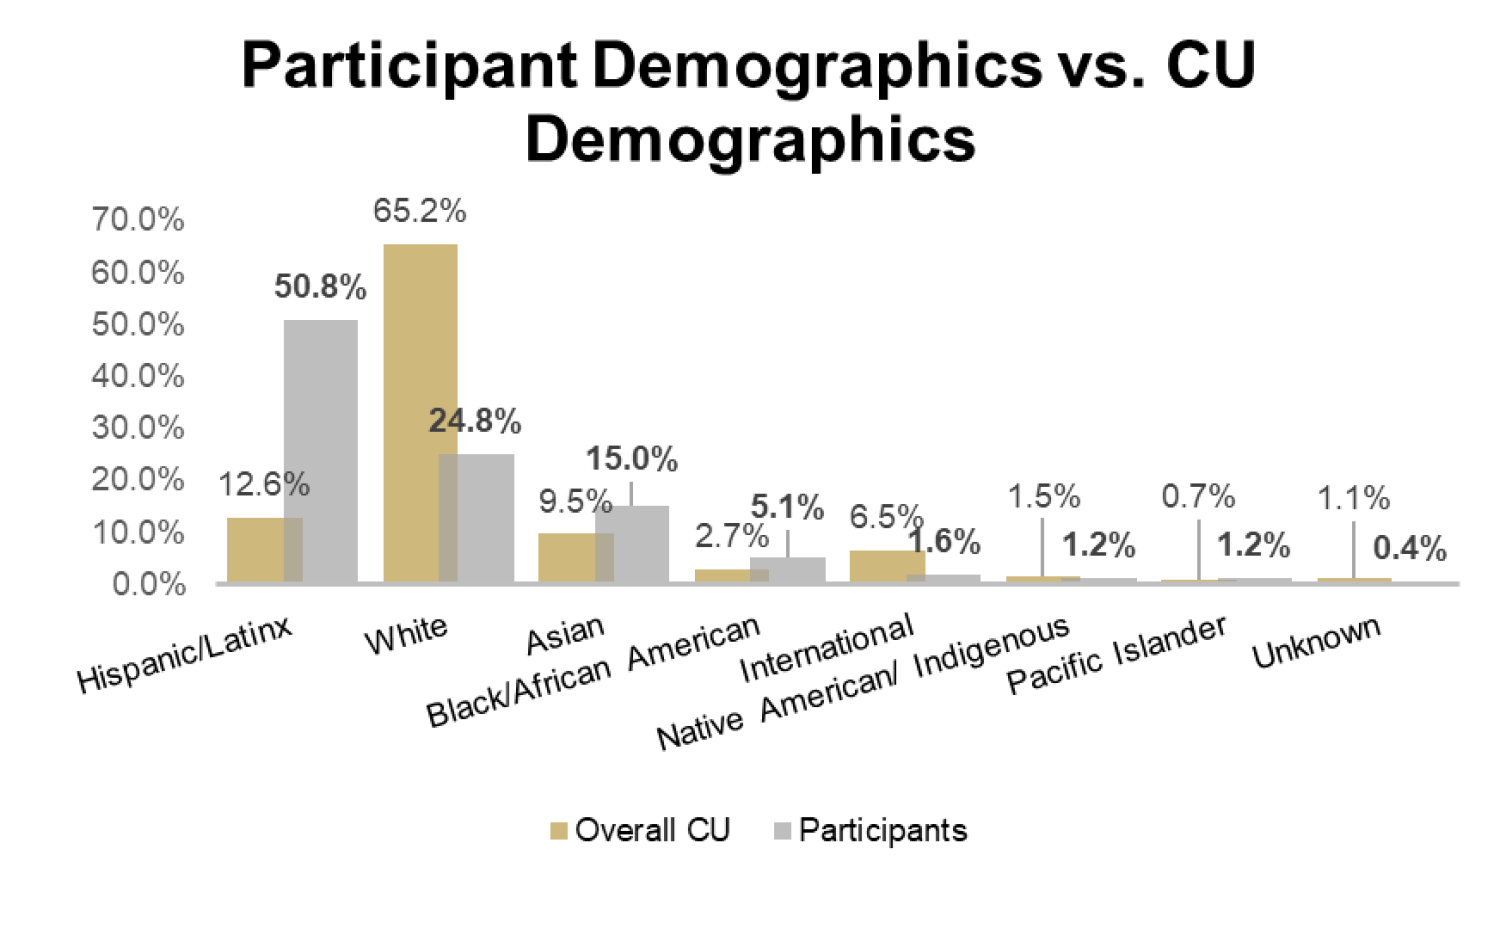
Comparison of participant race demographics to overall CU Boulder race demographics
Race/Ethnicity | Overall CU Population | First-Gen Participants |
|---|---|---|
Hispanic/Latinx | 12.6% | 50.8% |
White | 65.2% | 24.8% |
Asian | 9.5% | 15.0% |
Black/African American | 2.7% | 5.1% |
International | 6.5% | 1.6% |
Native American/ Indigenous | 1.5% | 1.2% |
Pacific Islander | 0.7% | 1.2% |
Participation by Program:
- National First-Gen Day: 141 participants
- First-Gen Orientation: 126 participants
- First-Gen Friday Welcome: 46 participants
- First-Gen Friday Career: 43 participants
- First-Gen Friday Mindfulness: 32 participants
- First-Gen Day of Service: 8 Participants